Download

1 / 0
0 likes | 163 Views
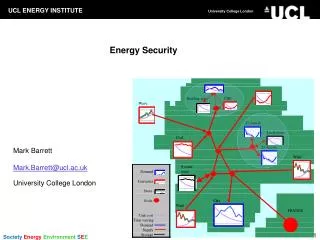
HUMAN SECURITY, ENERGY SECURITY PROVOCATIONS Peter Hayes Nautilus Institute Global Studies, RMIT University www.nautilus.org. “TRANSFORMING ENERGY INITIATIVES FROM AUSTRALIAN AND INDIAN PERSPECTIVES: ACCESS AND INNOVATION: Deakin University October 17, 2012 State Library of Victoria.

E N D