Download
1 / 18
180 likes | 351 Views
Concept Definition Phase for Clean Electric Power Systems. Apollo lessons. “ We will put a man on the moon before the end of the decade and return him safely to earth ” JFK May 25, 1961. Start with the ultimate goal Characterize alternative systems Choose a direction.

E N D
Concept Definition Phasefor Clean Electric Power Systems Dr. Alex Pavlak; Future of Energy Initiative; 315 Dunham Ct., Severna Park, MD 21146-1670; (410)647-7334; alex@pavlak.net; http://sites.google.com/site/futureofenergyinitiative
Apollo lessons “We will put a man on the moon before the end of the decade and return him safely to earth” JFK May 25, 1961 • Start with the ultimate goal • Characterize alternative systems • Choose a direction Dr. Alex Pavlak; Future of Energy Initiative; 315 Dunham Ct., Severna Park, MD 21146-1670; (410)647-7334; alex@pavlak.net; http://sites.google.com/site/futureofenergyinitiative
Clean Energy goal confusion • These are not performance goals but technology options • Assumes that systems scale, the achievement can be incorporated into larger scale systems • Confused by politics and public perceptions Future of Energy objective • Focus on the ultimate objective and whole systems • Derive interim goals derived from ultimate objectives • Big reductions are inevitable • Fossil fuel is a finite resource • Flexible time frame • Sooner is better for health & environment • Climate change may accelerate schedule 30% renewables by 2030 20% wind by 2020 … Big (90%) reduction in fossil fuel consumption Dr. Alex Pavlak; Future of Energy Initiative; 315 Dunham Ct., Severna Park, MD 21146-1670; (410)647-7334; alex@pavlak.net; http://sites.google.com/site/futureofenergyinitiative
Classic concept definition Given ultimategoals Develop system concept models to explore, contrast, compare alternative feasible solutions Provide Society with factual feasible choices (m/s B) Follow on phases can be agile Dr. Alex Pavlak; Future of Energy Initiative; 315 Dunham Ct., Severna Park, MD 21146-1670; (410)647-7334; alex@pavlak.net; http://sites.google.com/site/futureofenergyinitiative
Allocated wind power goals Compatible with clean, (10% fossil fuel) systems Reliable electric power systems Competitive cost Dr. Alex Pavlak; Future of Energy Initiative; 315 Dunham Ct., Severna Park, MD 21146-1670; (410)647-7334; alex@pavlak.net; http://sites.google.com/site/futureofenergyinitiative
Wincharger system • Zenith Radio “farm” (DC) radio • ~ 750,000 systems 1930-1940s • Provided farmers with quality radio! • Radio was most expensive component • Battery sized for 4 days storage • High electricity cost ~ $2/kWh • Unreliable during July-August • Did not survive rural electrification Dr. Alex Pavlak; Future of Energy Initiative; 315 Dunham Ct., Severna Park, MD 21146-1670; (410)647-7334; alex@pavlak.net; http://sites.google.com/site/futureofenergyinitiative
Wind systems are inefficient • Robust systems come from interconnection of a large number of independent generators • Reliable clean wind systems require • Full redundancy • Overbuilding wind • Additional transmission assets. Dr. Alex Pavlak; Future of Energy Initiative; 315 Dunham Ct., Severna Park, MD 21146-1670; (410)647-7334; alex@pavlak.net; http://sites.google.com/site/futureofenergyinitiative
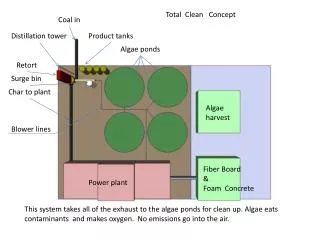
Wind + fossil fuel + storage* Paper summary • 0.1% fossil fuel system for PJM region appears to be technically feasible • 3x wind energy overbuild, discard 2/3 of electricity • ~ 24 hours storage • Full peak power fossil fuel backup ~8 hrs/yr • Stated cost ~ 38¢/kWh Critique • Extreme events (July) drive system size • $0.38/kWh cost estimate is optimistic (>$0.67/kWh) • Large environmental impact ~24,000 sq miles, the size of West Virginia • Concept is sound but needs classical concept development * Budischak, et al, Cost minimized combinations of wind, solar, storage, Journal of Power Sources 225, 2013, pp. 60-74 Dr. Alex Pavlak; Future of Energy Initiative; 315 Dunham Ct., Severna Park, MD 21146-1670; (410)647-7334; alex@pavlak.net; http://sites.google.com/site/futureofenergyinitiative
Basis for system concept trades PJM load 2012 Curtailment begins at 25% • PJM published wind & load data • CY2012 • EIA published cost estimates, • New 2018 installations • Wind, natural gas, nuclear • 15% reserve margin • No wind contribution to system capacity • Full redundancy • No transmission constraints Dr. Alex Pavlak; Future of Energy Initiative; 315 Dunham Ct., Severna Park, MD 21146-1670; (410)647-7334; alex@pavlak.net; http://sites.google.com/site/futureofenergyinitiative
All natural gas system • Reference scenario • 100% emissions • Cost includes system reserves Portions of this figure are taken from a paper by Gourdazi, Pavlak, “Concept trades for wind Energy Systems” accepted by ASME Power 2014 conference, July 2014 Dr. Alex Pavlak; Future of Energy Initiative; 315 Dunham Ct., Severna Park, MD 21146-1670; (410)647-7334; alex@pavlak.net; http://sites.google.com/site/futureofenergyinitiative
NG + wind +ideal storage • Add wind + ideal storage • Concept limit • Ideal storage • Large size, zero cost, 100% efficient • 100% of wind generation displaces natural gas • Line slopes up to the right because wind capital cost exceeds Ngas variable cost Portions of this figure are taken from a paper by Gourdazi, Pavlak, “Concept trades for wind Energy Systems” accepted by ASME Power 2014 conference, July 2014 Dr. Alex Pavlak; Future of Energy Initiative; 315 Dunham Ct., Severna Park, MD 21146-1670; (410)647-7334; alex@pavlak.net; http://sites.google.com/site/futureofenergyinitiative
Wind without storage Curtailed system cost Portions of this figure are taken from a paper by Gourdazi, Pavlak, “Concept trades for wind Energy Systems” accepted by ASME Power 2014 conference, July 2014 • Curtailment at PJM 2012 • Begins at 26% • Bites at 50% Dr. Alex Pavlak; Future of Energy Initiative; 315 Dunham Ct., Severna Park, MD 21146-1670; (410)647-7334; alex@pavlak.net; http://sites.google.com/site/futureofenergyinitiative
Grid scale storage Storage state of charge Portions of this figure are taken from a paper by Gourdazi, Pavlak, “Concept trades for wind Energy Systems” accepted by ASME Power 2014 conference, July 2014 Storage system impact • Storage size is 2,135 GWh • One day at average load • Estimated cost $200 $/kWh based on Bath Co, VA pumped hydro facility • 1,000 ft vertical elevation • 0.4 sq mile upper reservoir • 105’ level change • 80% round trip efficiency • 68 Bath county facilities required Dr. Alex Pavlak; Future of Energy Initiative; 315 Dunham Ct., Severna Park, MD 21146-1670; (410)647-7334; alex@pavlak.net; http://sites.google.com/site/futureofenergyinitiative
Nuclear power Nuclear model Portions of this figure are taken from a paper by Gourdazi, Pavlak, “Concept trades for wind Energy Systems” accepted by ASME Power 2014 conference, July 2014 Nuclear on system cost/performance • Nuclear follows daily minimum • Diurnal variations • All Ngas • Ngas & hot water storage Dr. Alex Pavlak; Future of Energy Initiative; 315 Dunham Ct., Severna Park, MD 21146-1670; (410)647-7334; alex@pavlak.net; http://sites.google.com/site/futureofenergyinitiative
Comparison with Budischak Portions of this figure are taken from a paper by Gourdazi, Pavlak, “Concept trades for wind Energy Systems” accepted by ASME Power 2014 conference, July 2014 Dr. Alex Pavlak; Future of Energy Initiative; 315 Dunham Ct., Severna Park, MD 21146-1670; (410)647-7334; alex@pavlak.net; http://sites.google.com/site/futureofenergyinitiative
Retail electricity prices • MD at 8% renewables, mostly hydro pays 11 cts/kWh • Germany with 25% renewables pays 36 cts/kWh • Something is missing! Portions of this figure are taken from a paper by Gourdazi, Pavlak, “Concept trades for wind Energy Systems” accepted by ASME Power 2014 conference, July 2014 Dr. Alex Pavlak; Future of Energy Initiative; 315 Dunham Ct., Severna Park, MD 21146-1670; (410)647-7334; alex@pavlak.net; http://sites.google.com/site/futureofenergyinitiative
Conclusions • Focus on • Ultimate goals • Complete systems • To do • Transmission upgrades internal to the system • Congestion induced curtailment • Multiple years • Multiple regions • Storage parameter variation • Add solar PV • EIA cost refinement Dr. Alex Pavlak; Future of Energy Initiative; 315 Dunham Ct., Severna Park, MD 21146-1670; (410)647-7334; alex@pavlak.net; http://sites.google.com/site/futureofenergyinitiative
Join the Hangout alex@pavlak.net Dr. Alex Pavlak; Future of Energy Initiative; 315 Dunham Ct., Severna Park, MD 21146-1670; (410)647-7334; alex@pavlak.net; http://sites.google.com/site/futureofenergyinitiative