Download
1 / 25
250 likes | 272 Views
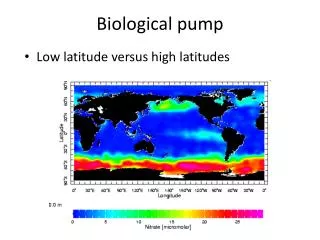
In this presentation, Mary Jane Perry from the University of Maine provides insights based on limited knowledge of EURO-BASIN activities. The aim of WP2 is to study particle dynamics in marine ecosystems in the North Atlantic, focusing on particle formation, sinking, and decomposition. Key questions addressed include the amount, nature, speed, and controls of sinking particles. The presentation references the Autonomous North Atlantic Bloom experiment and discusses the importance of understanding sinking rates and aggregation dynamics. Data from experiments and observations shed light on the processes influencing carbon export in the North Atlantic.

E N D
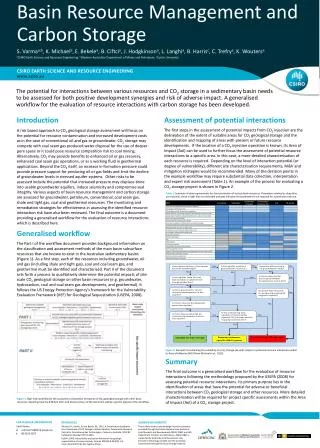
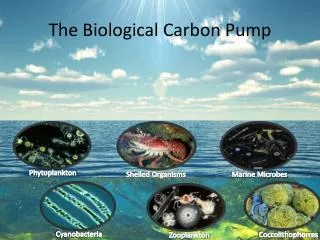
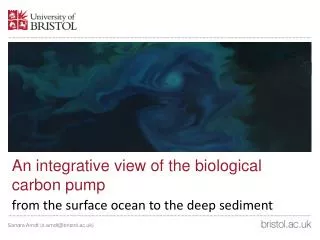
EURO-BASIN WP2The Biological Carbon Pump Comments by Mary Jane Perry University of Maine 6 November 2012 Disclaimer – my comments are based on a very limited knowledge of the full suite of EURO BASIN extensive activities. Some slides are based on an earlier version of Adrian Martin’s presentation. Apologies in advance for any incorrect statements.
WP2 Aim – important and very challenging Produce new observations of particle formation, aggregation, sinking, and decomposition for a range of marine ecosystems in the North Atlantic, through lab, mesocosm and field studies. Combine results with literature data to generate new particle flux algorithms. BASIN scale – proceeds dynamic range of community structure and of physical/chemical forcing Correct parameterize key to realistic models.
WP2 Key Questions • How much is sinking? (is that the reason for discrepancy observed by Steinberg?) • What is sinking? • What controls the speed of sinking? • What controls the rate of attenuation?
AS WAY OF BACKGROUND – I will reference the Autonomous North Atlantic Bloom experiment – Eric D’Asaro, Craig Lee, and myself.Evolution of the Bloom from early April through late June 2008.Process cruise in May (3 weeks). Perry et al., OCB News, Fall 2012
We successfully captured the start of the bloom with one float and 4 gliders. Similar to satellite. PATCHY bloom. Mahadevan et al., 2012, Science
2 months of Lagrangian float data in upper 230 m.NCP from changes in NO3 and O2;export flux from difference between NCP and POC. Alkire et al., 2012, DRS
WP2 Key Questions • How much is sinking? • What is sinking? • What controls the speed of sinking? • What controls the rate of attenuation?
Very nice approach How much sinks out of upper100m, sinks slowly, and is respired? (Alkireet al., 2012, DSR) Would be good to couple with sediment traps; also with optical spikes (more later) for projecting results to broader spatial scale. Marine snow catcher Allows fractionation of export. 33 deployments 7 profiles of 4 depths between 50 – 600 m ~ 300 particles analysed Mid-term Synthesis Workshop, Lisbon 6-8th Nov 2012 www.euro-basin.eu
WP2 Key Questions • How much is sinking? • What is sinking? • What controls the speed of sinking? • What controls the rate of attenuation?
Very nice result Small aggregates containing large, heavy foram tests (light green)collide with slower sinking aggregates (dark green), fragmenting them and preventing large aggregates from growing Aggregates incorporating coccoliths (blue) sink quickly for their size, relative to aggregates formed in the absence of the coccoliths (red). aggs w/foram tests aggs w/coccos diatom aggs not exposed to calcite ballast aggs w/o foram but from foram exp Role of TEP physiology is important De La Rocha, in prep Mid-term Synthesis Workshop, Lisbon 6-8th Nov 2012 www.euro-basin.eu
Question on formation of aggregates, in lab and mesoscom experiments – how much does concentration affect aggregate size, magnitude of flux and aggregate sinking rate?These are high particle concentrations; can results be scaled to field concentrations that are only ~ 10% ?
Beautiful data, but bit of a puzzle – speeds are much higher than mesocosm, but few coccoliths. Denser big particles do sink faster. Velocity ~ a*ESDb + c*Transparency Transparency: > 60% 40-60% 20-40% < 20% Marine snow catcher sinking speed Giering, in prep Mid-term Synthesis Workshop, Lisbon 6-8th Nov 2012 www.euro-basin.eu
Iceland Basin 2008 North Atlantic – sudden appearance of ‘spikes’ in all optics; spikes are caused by sinking aggregates. (from Briggs et al. 2011, DSR)
Spikes appeared suddenly, and were observed by all four gliders, as a ‘sinking front’. Hence, could compute sinking rates ~ 75 m/d. (similar to rates from the Snow Catcher). Make sure gliders measure optics deeper than 300 m (from Briggs et al. 2011, DSR)
WP2 Key Questions • How much is sinking? • What is sinking? • What controls the speed of sinking? • What controls the rate of attenuation? Very interesting relationship by UNI on C/N ratio of suspended material
Other estimates are from Thorium and C: Th ratios; is that a reason for discrepancy? How do these compare to other NA estimates? Or, are measurements from early bloom? Does flux scale w/NCP? Marine snow catcher Slow sinking flux vs previous estimates Giering, in prep Mid-term Synthesis Workshop, Lisbon 6-8th Nov 2012 www.euro-basin.eu
Iceland Basin 2008 North Atlantic bloom – comparison of flux from different approaches (from Briggs et al. 2011, DSR)
Phytoplankton and zooplankton community composition makes a difference in flux • Station 3 – Norwegian Sea • Small flagellates but few diatoms • Lots of microzooplankton • Station 1 – Iceland Basin • Lots of large diatoms • Few microzooplankton • Calanus
Iceland Basin 2008 North Atlantic bloom community composition evolved, and with it the rate of carbon export. Export additionally scaled with magnitude of NCP. Alkire et al., 2012, DRS Sieracki, pers. comm.
Patchy ocean – use information about the community structure to project export rates to a larger scales.
WP2 Key Questions • How much is sinking? • What is sinking? • What controls the speed of sinking? • What controls the rate of attenuation? ***
Chlorophyll is a proxy for labile POC. Is this microbial? Marine snow catcher Decomposition of slow-sinking flux Giering, in prep Mid-term Synthesis Workshop, Lisbon 6-8th Nov 2012 www.euro-basin.eu
Similar pattern from Iceland Basin 2008 North Atlantic bloom, based on optical spikes ~~ in situ proxy for sinking aggregates (from Briggs et al. 2011, DSR) Estimated sinking rate ~ 75 m/day. Exponent b =1.03 +/- 0.32
Nature of material that sinks matters for attenuation.Chaetocerosresting spores comprised 10-60% of POC in PELAGRA sediment traps. Spores are more resistant to microbial degradation. (and why spores in the deep sea?) C Rynearson et al. – manuscript; graphics- Poulton & Sieracki
EURO BASIN WP2 is focussing on export control processes that vary in different regions/ communities. • This work represents a major step forward in the understanding of mechanisms in the BCP. • Knowing space and time scales when a particular mechanism operates is crucial for accurately and adequately representing the BCP in models, and for predictions under various climate change scenarios.