Download
1 / 15
150 likes | 389 Views
Evaluation of shellfish aquaculture and nutrient removal and credit trading in Long Island Sound. Suzanne Bricker NOAA National Ocean Service Joao Ferreira IMAR Katharine Wellman Northern Economics

E N D
Evaluation of shellfish aquaculture and nutrient removal and credit trading in Long Island Sound Suzanne Bricker NOAA National Ocean Service Joao Ferreira IMAR Katharine Wellman Northern Economics Gary Wikfors NOAA National Marine Fisheries Service Mark Tedesco EPA Long Island Sound Study Julie Rose NOAA National Marine Fisheries Service Bob Rheault East Coast Shellfish Growers Association Robin Landeck Miller HydroQual Paul Mankiewicz The Gaia Institute Estuarine & Coastal Sciences Association: ECSA47 Symposium Figueira da Foz, Portugal September 14-19, 2010
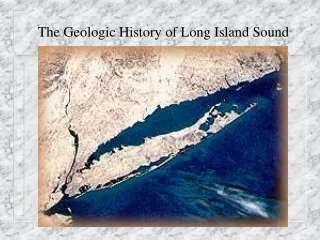
Long Island Sound: Background New York Connecticut Size: 3,259 km2 Tide: 2 m in west, 1 m in east Residence time: 2-3 months Highly developed watershed Population: 4.9 x 10⁶ total, 1,508 people/km2 2/3 freshwater inflow from Connecticut River The Long Island Sound Study names 4 major water quality issues being addressed by government agencies, environmental groups, universities and the private sector: • Nutrients and hypoxia - eutrophication • Toxic Contaminants and pollution • Pathogens • Floatable debris
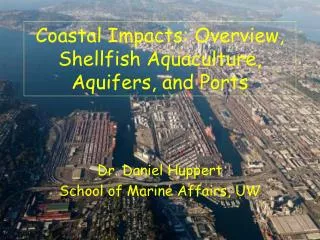
EPA Regional Ecosystem Services Program– Eutrophication and shellfish aquaculture • Two year project, EPA funded, focus on Long Island Sound and Great Bay/Piscataqua region; • Research groups from NOAA, EPA, HydroQual Inc., Longline Environment Ltd., Northern Economics, Shellfish Environmental Services; • Conduct a comparative study on the bioextraction potential of shellfish, and its contribution to ecosystem services; • Species: Eastern oyster, Northern quahog, ribbed mussel; • For Long Island Sound (major case study): combine watershed models, detailed water quality models (SWEM), EcoWin2000, FARM, and economic models.
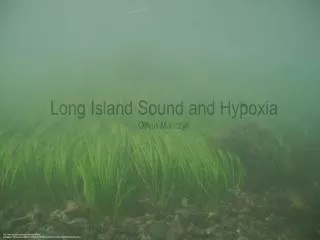
LIS Eutrophication Impacts Loss of eelgrass from historic range Hypoxia Species shifts (Picture or explanation?)
Since early 1990s: Nuisance/toxic blooms improved Macroalgae improved Chl no change SAV no change DO worsened NEEA/ASSETS Results: LIS Highly Eutrophic Bricker et al. 2007, Nutrient enrichment in the nation`s estuaries, A decade of change. National Estuarine Europhication Assessment Update. www.eutro.us
Potential Resolution of Nutrient issues:Long Island Sound TMDL*(Approved by EPA April 2001) • In-basin Nitrogen Reduction Goal • 58.5% by 2014 • 10% reduction to urban and agricultural runoff • 59-64% reduction to point sources • Allows “Trading” of nutrient credits • Out-of-basin Actions • Out of State Sources (10% reduction to runoff, 25% reduction to point sources) • Atmospheric Deposition (Clean Air Act reductions) • Alternatives to nutrient control • Biomass harvesting • Periodic Revision (Adaptive Management) • Evaluation in 2008 *Total Maximum Daily Load
Potential Resolution of Nutrient issues:nutrient bioextraction considered for LIS • Longtime nitrogen management focus has been point sources (i.e. wastewater treatment plant upgrades) • Growing recognition that non-point source pollution is also a substantial (more difficult) problem • Nutrient bioextraction can also address legacy pollution in the water column and sediments International Workshop on Bioextractive Technologies for Nutrient Remediation December 3-4, 2009 at UConn Stamford
How does bioextraction work? • Cultivation and harvest of shellfish and macroalgae • Nutrients are taken up directly (seaweed) or indirectly (shellfish, via plankton, organic detritus) • Removal of biomass removes nutrients from the ecosystem • Removal of 1ary eutrophication symptoms reduces 2ary symptoms by (i) improving water clarity, restoring SAV; (ii) limiting D.O. loss from decomposition of organic matter • Shellfish farmers can negotiate nutrient credits to offset loading fom land, and be included in the trading program
Scope of shellfish aquaculture:American Oyster (Crassostreavirginica), Northern Quahog clam (Mercenariamercenaria) Harvest – Bottom Culture Shellfish lease area 20 kT State Approved Restricted Prohibited Total as % total area 103 acres NY 84 0.2 16 489 CT 51 31 18 444 NY/CT 68 15 17 934 27 kT NY only Approved for CT includes conditionally approved, for NY Approved is represented by Certified and Restricted is represented by Seasonal rating. Prohibited (CT) and Uncertified (NY) are considered equal. On the basis of a yield of 10 tonnes ha-1 (1 kg m-2), the reported harvest of ~17,000 tonnes (37 million lb) would correspond to 17 km2, i.e. ~4200 acres
The REServ approach Economic model Millennium Ecosystem Assessment Framework Field measurements Farm-scale modelling FARM model Catchment model SPARROW, Watershed Runoff Modelling System- and local-scale ecological modelling E2K, FARM, ASSETS System-scale ecological modelling SWEM, E2K, ASSETS Transport model SWEM Public participation Individual growth models for cultivated species Ribbed mussel In situ and lab experiments
Preliminary simulations of biomass harvesting show substantial DO improvements Phase 3 & 4 TMDL: N & Corg 4.0 3.0 2.0 1.0 0.0 With shellfish and seaweeds Minimum D.O (mg L-1) +4.0 +2.0 0.0 -2.0 -4.0 System-Wide Eutrophication model (SWEM) HydroQual, 2009. Model year simulation: 1988 Delta min.D.O (mg L-1) Change in dissolved oxygen through the use of IMTA
Data Drivers for simulated farm Simulated farm location is within approved lease areas Data for Station 09 for 2008 Thanks to Matt Lyman of CTDEP Simulated farm location from CTDEP aquaculture bottom lease maps and CTDEP data for station 09 for drivers of FARM
Preliminary FARM model results Total N load to LIS = 50 x103 t y-1
Summary and Conclusions • Biomass harvesting – • promising solution to nutrient issues • complementary to land-based nutrient load reductions • provides shellfish product, income for shellfish farmers • caveat: marine spatial planning • Significance to LIS nutrient budget not known but - • 45 tons N removed in one 10 hectare farm (PEQ 13,600) • Shellfish cultivation in 3% LIS area would remove equivalent of present N load • If significant, will shellfish farmers become part of the LIS nutrient trading program? • Stay tuned Try the models yourself: FARM www.farmscale.org ASSETS www.eutro.org/register