Download
1 / 89
890 likes | 920 Views
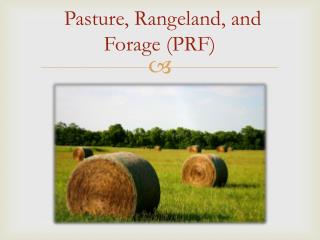
This presentation provides an introduction and program overview of the Pasture, Rangeland, Forage (PRF) insurance plans. It covers the science behind the program, program basics, additional tools and information, and a detailed example. It includes information on both the Rainfall Index and Vegetation Index programs.

E N D
PASTURE, RANGELAND, FORAGE (PRF) PLANS OF INSURANCE This presentation does not replace or supersede any procedures or modify any provisions contained in the complete insurance policy.
INTRODUCTION AND PROGRAM OVERVIEW Introduction and Overview Science Behind the Program Program Basics Additional Tools and Information Detailed Example
Both History • History • Two new pilot programs approved for 2007 Crop Year • Pasture, Rangeland, Forage (PRF) – Rainfall Index • Pasture, Rangeland, Forage (PRF) – Vegetation Index • Both programs covered in this presentation • Slides covering both programs • Slides covering Rainfall Index Only • Slides covering Vegetation Index Only Both Rainfall Vegetation
Both Introduction • Beginning with the 2007 Crop Year
Both Challenges • Crop challenges • Various plant species • Timing of plant growth • Crop continuously harvested via livestock • Lack of individual/industry data • Vast range of management practices across the industry • Publicly announced prices not available
Both Crop Types • Grazingland • Established acreage for perennial forage • Intended for grazing by livestock • Acreage must be suitable for grazing • Hayland • Established acreage for perennial forage • Intended for haying • Acreage must be suitable for haying • Program covers all types of grazing and haying forage • (i.e. not just alfalfa)
Both Program Overview • GRP program • Group plan • Losses cover an area • No individual coverage • Index – based on precipitation or greenness • Not measuring actual individual production • No loss adjustments, records, etc. • Timely payments • Does not reward poor management practices
Rainfall Program Overview • Index background • Lack of actual producer/industry production data • No consistent and practical methodology for measuring production of the crop • The deviation from long-term normal precipitation is used to establish the index • SINGLE PERIL COVERAGE • Precipitation has a high degree of correlation to forage production
Vegetation Program Overview • Index background • Lack of actual producer/industry production data • No consistent and practical methodology for measuring production of the crop • The deviation from long-term normal ‘greenness’ is used to establish the index • Crop ‘greenness’ reflectivity has a high degree of correlation to forage production
Program Overview Grid Overview
Rainfall Program Overview • Area of insurance = 0.25o grids (~ 12 x 12 miles)
Vegetation Program Overview • Area of insurance = 8 x 8 km(~ 4.8 x 4.8 miles)
Program Overview Index Intervals
Rainfall Program Overview • Index Intervals • Multiple Intervals offered – 6 • Crop Year divided into 6, 2-month Intervals for each grid • Ability for producers to manage appropriate timing risks • Correlate to individual growth patterns and production seasons • The 2-month Intervals provide for greater reaction to precipitation events vs. a yearly average
Rainfall Program Overview • Index Intervals Intervals 6, 2-month I II III IV V VI Crop Year 12 months Begins February 1st
Rainfall Program Overview • Index Intervals • Producers must select at least 2 Intervals • The purpose of the program is to insure annual forage production • Total annual forage production is influenced by precipitation in more than one 2-month Interval; therefore, producers are required to insure in more than one Interval Maximum percentages are region specific • Based on growing season (50 – 70%)
Vegetation Program Overview • Index Intervals • Multiple Intervals offered – 4 • Crop Year divided into 4, 3-month Intervals for each grid • Ability for producers to manage appropriate timing risks • Correlate to individual growth patterns and production seasons • The 3-month Intervals provide for greater reaction to forage reduction events vs. a yearly average
Vegetation Program Overview • Index Intervals Intervals 4, 3-month I II III IV Crop Year 12 months Begins April 1st
Vegetation Program Overview • Index Intervals • Producers may select more than 1 Interval • The purpose of the program is to insure annual forage production • Minimum amount if more than one Interval is selected is 10%
Both Program Overview • Index Intervals • Minimizes dependency on subjective pre-determined forage growing seasons • Maintains consistency across the country • Allows for regional and local variance • Allows individual freedom to select appropriate Intervals • Index Intervals are mutually exclusive • One index does not effect the others • All rated separately • These Intervals act as ‘mini-insurance periods’
Rainfall Index Intervals INDEX INTERVALSSTART DATEEND DATE (221) Index Interval I February 1 March 31 (222) Index Interval II April 1 May 31 (223) Index Interval III June 1 July 31 (224) Index Interval IV August 1 September 30 (225) Index Interval V October 1 November 30 (226) Index Interval VI December 1 January 31 I II III IV V VI
Vegetation Index Intervals INDEX INTERVALSSTART DATEEND DATE (231) Index Interval I April 1 June 30 (232) Index Interval II July 1 September 30 (233) Index Interval III October 1 December 31 (234) Index Interval IV January 1 March 31 I II III IV
Both Program Overview • Coverage Levels • Percentages available: 90, 85, 80, 75, and 70 • Consistent with other GRP programs • Higher coverage levels reduce basis risk • Correlates closer to individual experience • Sales Closing Date & Acreage Reporting Date • November 30th
Both Program Overview • Rating • Each grid, Index Interval, and coverage level is individually rated • No economic advantage of insuring in one scenario vs. another • Encourages producers to select a scenario that best mitigates their operation/production risks
Both Program Overview • Not required to insure 100% of acreage • Forage utilized in the annual grazing or hay cycle can be insured without insuring all acreage • All acres within a property may not be productive, e.g., rocky areas, submerged areas • Provides additional flexibility for the insured to design the coverage to his specific needs • Because the program is a group program and other programs are not available, there is no opportunity to ‘move’ production
Both Program Overview • Program supported via internet • Provides the most efficient and effective way to deliver the program • Allows access to the mapping tools • Locate grazing areas and associated Grid ID numbers • Provides access to the historical indices • Allows access to all relevant data, materials, and tools associated with the program
Both Crop Biology • The program addresses forage-based production systems on land areas producing primarily perennial vegetation • Comprised of diverse plant communities and mixtures: • Perennial and annual • Warm season and cool season • Different growth habits over extended time periods
Both Crop Biology • Forage may be harvested directly by grazing animals, harvested for hay, or a combination of both: • Continual harvest and/or single haying • Capacity to live and reproduce from year to year • Because of the nature of forage-based systems, the program is designed to insure annual production
Both Program Technology • Indices are highly correlated with forage production, but do not directly predict actual forage production • PRF Rainfall Index – Precipitation data • PRF Vegetation Index – NDVI data • Index starts accumulating on the first day of the specified Interval through the last day of the same Interval • At the end of each Interval, the percent of normal is calculated • Influence of extreme precipitation events is effectively reduced Rainfall Vegetation Rainfall Only
Rainfall Program Technology • Daily historical data since 1948 • Data updated daily • Data is interpolated by NOAA into weather grids nationwide • ~ 12 x 12 miles in size (0.25o data), and used in many other national programs
Rainfall Grid Example for Texas
Vegetation Program Technology • Historical data since 1989 • Data updated every 14 days • Grids are ~ 4.8 x 4.8 miles in size, and used in many other national programs • NDVI captures vegetation ‘greenness’ • Temperature correction for excessive hot and cold temperaturessuppressing growth even when plants are green
Vegetation Grid Example for Oklahoma
Both Basic Definitions • Insurable Acreage:Hayland and grazingland that is not planted annually • Overseeding into acreage of existing forage crops is acceptable • Annually planted crops currently not insurable • Insurable acres will consist of the total number of acres suitable for insurance under these crop provisions • Includes both insured acres and uninsured acres
Both Basic Definitions • Insured Acres:The number of insurable acres selected to be insured by a producer • May choose to insure either Grazingland, Hayland, or both • Not required to insure 100% of the crop type(s) • If the insured chooses to insure the crop types under this policy they cannot insure the same crop under any other FCIC subsidized program
Basic Definitions • County Base Value: Established production value of grazingland and hayland forage • Only one value per county for each crop type • Productivity Factor: A percentage multiplier allowing the insured to individualize coverage based on their individual crop productivity • Insured selects between 60% and 150% • Only one productivity factor may be selected per county and crop type
Both Basic Definitions • Policy Protection per Unit:Dollar amount of protection per acre, multiplied by the insured acres, multiplied by the producer’s share of the unit for each grid EXAMPLE: $ Amount of Protection/ac = $18.00, Insured Acres = 1,000, Share = 100%, 50% Interval II, 50% Interval III For: Index Interval II: $18.00 x 500 ac x 100% (share) = $9,000 Index Interval III: $18.00 x 500 ac x 100% (share) = $9,000 • PolicyProtection: The sum of the policy protection per units ($18,000)
Rainfall Program Dates 11/30 Sales Closing / Acreage Reporting 02/01 Start of Crop Year 10/01 Premium Billing 01/31 End of Crop Year 08/31 Contract Change
Vegetation Program Dates 11/30 Sales Closing / Acreage Reporting 04/01 Start of Crop Year 10/01 Premium Billing 03/31 End of Crop Year 08/31 Contract Change
Both Index Definitions • Expected Grid Index:Based on the historical mean accumulated data by Index Interval, expressed as a percentage; EGI = 100 • Data = precipitation • Data = NDVI greenness • Final Grid Index:Based on the current accumulated data for each Index Interval • If current data represents a 40% reduction, then FGI = 60 • Data = precipitation • Data = NDVI greenness • Trigger Grid Index: The selected coverage level multiplied by the Expected Grid Index • i.e. - Coverage Level = 85; then Trigger Grid Index = 85 • If the final grid index falls below the trigger grid index, the insured may be due an indemnity Rainfall Vegetation Rainfall Vegetation
Both Rates and Premiums • Premium Rate • Applied to cover risk • Based on the level of risk with each scenario • Each scenario independently rated • Not an application fee (ie., NAP) • Subsidy • Premium is subsidized by USDA
Both Trigger and Indemnity Example EXAMPLE: Trigger Grid Index (Coverage Level) = 85 Final Grid Index: Interval II = 90, Interval III = 60 Payment Calculation Factor = Index Interval II: (85 – 90)/85 = No indemnity due (90 > TGI) Index Interval III: (85 – 60)/85 = 0.294 Total Indemnity = $2,646 Index Interval II = $0 Index Interval III = ($9,000 x 0.294) = $2,646 {$18.00 x 500 (acres in III) x 1.0 (share)} x 0.294 = $2,646
Both Grid ID Selection • Grid ID: A specific code associated with each grid • Point of Reference: A designated point, identifiable by longitude and latitude • Selected by the insured • Point that best represents the insured acreage • This determines the Grid ID for insurance
Both Grid ID Selection • Certify the points of reference are representative of the acreage assigned to each Grid ID and the amount of acreage in each Grid ID(s) • Example: if the contiguous acreage is located in four grids the acreage can be separated into two, three, or four grids – or left all in one grid • The same acres cannot be insured in more than one Grid ID or county • Determine the point of reference and corresponding Grid ID by Sales Closing Date
Both Examples of Determining Grid ID(s) • Contiguous Acreage – One Grid • The insured picks one point of reference on the property
Both Examples of Determining Grid ID(s) • Contiguous Acreage – Multiple Grids, Counties, and/or States (Combined) • The insured picks one point of reference in the contiguous acreage (could pick Grid 1 or Grid 2)
Both Examples of Determining Grid ID(s) • Contiguous Acreage – Multiple Grids, Counties, and/or States (Separated) • The insured selects one point of reference in each Grid and assigns the number of acres 50 Total Acres
Both Examples of Determining Grid ID(s) • Determining the Grid ID (s) for Non-Contiguous Acreage (multiple properties) • A point of reference must be selected for each separate, non-contiguous acreage • The steps in determining the point of reference are similar to the steps outlined for contiguous acreage, simply repeated for each non-contiguous acreage to be insured