Leveraging Dashboards for Effective Program Management in Nonprofit Care Coordination
Explore the effective use of dashboards in program management within nonprofit care organizations. Developed by Choices, Inc., a nonprofit founded in 1997 to address the high costs of youth care out of state, this presentation highlights key performance metrics that improve service delivery for youth and families. With more than 150 employees and a budget of $36 million, Choices has served over 600 youth daily. Discover how dashboards enhance coordination, track spending, and improve outcomes across multiple child-serving systems.


Leveraging Dashboards for Effective Program Management in Nonprofit Care Coordination
E N D
Presentation Transcript
Using a Dashboard for Program Management Monday, April 19, 2010 Shannon Van Deman, MBA
Choices, Inc. • Non profit care management organization created in 1997 • Developed around a community need: “high cost youth out of state” • Blended system of care principles with wraparound values and managed care technology.
Choices Care Management • Over 150 Employees • $36 Million Annual Budget • Over 600 youth served in Child Family Teams daily • Working across ALL child serving systems – 60% CW 180 80 220 100 20 Indianapolis – Indiana (1997) Cincinnati – Ohio (2002) Rockville – Maryland (2005) Baltimore County – Maryland (2006) Washington DC (2008)
Care Coordination Child Welfare Friend Family Mental Health/ Substance Abuse Teacher Pastor Care Coordinator Provider Network Case Rate PLAN
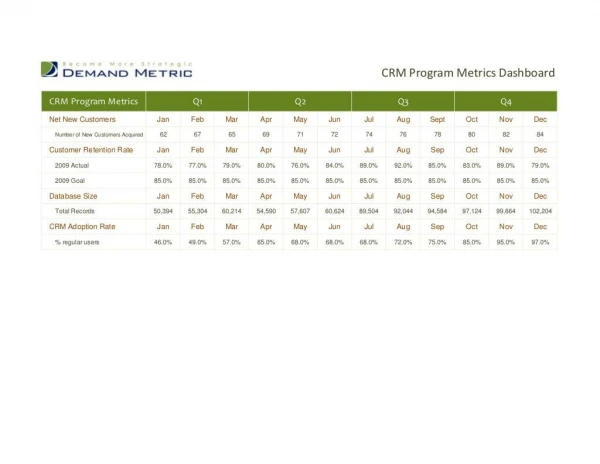
Dashboard: Key Performance Metrics? • Youth and family functioning • Time spent with youth and families • Dollars spent on youth and families • Service mix
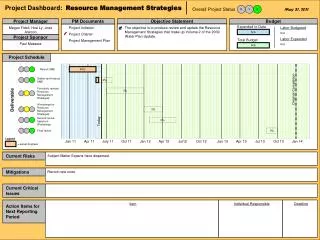
Dashboard • Identify key performance metrics • Develop a mechanism to collect the data • Figure out how to deliver the data • Introduce the dashboard to staff • Roll out is KEY!
Fun Future Directions Corporate Names Ticker Tapes “Business School”
Conclusions • Dashboards are beneficial for care coordinators • They manage huge amounts of tax payer dollars • They work across systems and facilitate meetings • They are responsible for the children and families they serve • Can help advance children’s mental health
Thank You! www.ChoicesTeam.org Choices, Inc. 4701 N. Keystone Ave. Suite 150 Indianapolis, IN 46205 (317) 726-2121