Download
1 / 15
150 likes | 259 Views
Planetary Ionospheres. How is an ionosphere formed ?. 1. What is an ionosphere ?. 4. How are aurora and airglow related to ionospheric formation and decay ?. 3. What determines the peak density and height of an ionosphere ?.

E N D
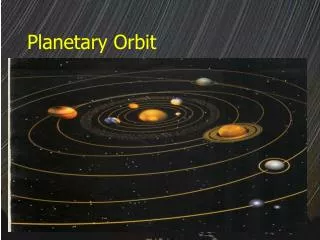
Planetary Ionospheres How is an ionosphere formed ? 1. What is an ionosphere ? 4. How are aurora and airglow related to ionospheric formation and decay ? 3. What determines the peak density and height of an ionosphere ? 5. What are the differences and similarities between the ionospheres of Earth, Mars and Venus ?
The Ionosphere is a Weakly Ionized Plasma broad definition: “the ionosphere is that region of the atmosphere (or gaseous envelope) surrounding a solar system body where significant numbers of low-energy free electrons and ions are present”
Existence of ionosphere suggested -- by Gauss, Lord Kelvin and Stewart Balfour in the 19th centuryFirst direct verification of its existence -- Marconi succeeded in sending radio signals across the Atlantic‘ionosphere’ coined by R.A. Watson in 1926First direct evidence of an ionosphere on a planet other than earth -- radio occultation measurements by Mariner 5 as it flew by Venus on October 19, 1967
Formation of Ionospheres Free electrons and positive ions can be formed by a) photoionization of neutrals b) energetic particles knocking electrons off neutrals
Photoionization in an Exponential Atmosphere In the following we assume, for simplicity, and to get across the basic concepts: • monochromatic radiation (i.e., small wavelength interval over which absorption and ionization cross-sections can be taken as constant) • isothermal atmosphere • horizontal stratification, i.e., n = n(z) • curvature of planet neglected
As z decreases, nj increases, so q increases; however, at some point is diminished so much by absorption that q begins to decrease as z decreases. Therefore, there is always a height at which q becomes maximum. Let us now derive that height and obtain an expression for the plasma production rate as a function of height. z ds = -dz sec Assume c ≤ 60º so that curvature can be neglected =photons cm-2sec-1 (photon flux) = intensity (erg cm-2sec-1) h = Planck’s constant c = speed of light = wavelength = (hc/l)
si = ionization cross-section q = electron production rate Optical Depth and Unit Optical Depth The attenuation of F along s due to absorption is given by (this relation basically defines sa, the absorption cross-section):
Peak Production of Plasma We have just shown that the peak production occurs at the altitude of unit optical depth. The level where F = F∞e-1 is a measure of penetration of a particular wavelength of radiation into the atmosphere.
By manipulating the previous equations, (see following page) it can be shown that where y is the distance in scale heights from the level of peak production. y For secc must be replaced by the ‘Chapman function’: q/qo In reality, one must sum over several constituents and a range of l’s: Chapman Layer
The ionosphere above 100 km is mainly produced by photoionization of O, O2 and N2 F E Fast followed by leaving
fast Photoproduction “rate- limiting” Charge transfer Ion-atom Interchange fast Dissociative Recombination fast slow Radiative Recombination metastable E and F-Region Chemistry
Below some altitude near 120-150 km [O2] >> [O], and the primary processes are Production of e- due to photoionization of O2 Electron production rate (P) = Electron loss rate (L) = Assuming photochemical equilibrium, i.e., P = L, the electron density profile follows that of the production rate: E-region peak production Ionosphere Profile Shape: E-Region and Bottomside F-Region To get across the essential ideas, for now consider only an O and O2 atmosphere.
Above the transition height, [O] >> [O2], and the primary processes are Rate of Production of O+ Rate of Loss of O+ = To first order, the last reaction “neutralizes” the O2+ as fast as it is produced. Assuming photochemical equilibrium, i.e., production = loss:
Note: Since , then the quantity in brackets is < 0, and hence the e- concentration increases with height. (loss decreases more rapidly with height than production)