Download
1 / 35
350 likes | 478 Views
Simulations on “Energy plus Transmutation” setup, 1.5 GeV. Mitja Majerle majerle@ujf.cas.cz. The document about simulations of EPT setup can be downloaded in form of report at : http://ojs.ujf.cas.cz/~mitja/articles/ept.pdf. Outline. Cluster of computers (linux) MCNPX 2.4.0

E N D
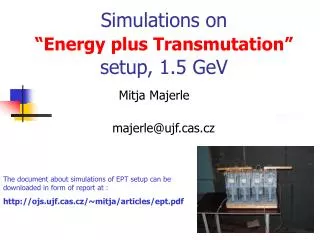
Simulations on “Energy plus Transmutation”setup, 1.5 GeV Mitja Majerle majerle@ujf.cas.cz The document about simulations of EPT setup can be downloaded in form of report at : http://ojs.ujf.cas.cz/~mitja/articles/ept.pdf
Outline • Cluster of computers (linux) • MCNPX 2.4.0 • First tests with PVM (in Třešt) • Simulations of PHASOTRON experiment (presented in Pavia, Avignon) • Simulations of ENERGY PLUS TRANSMUTATION setup (Dubna, Jaipur)
Cluster • 1 server (the slowest machine) • Hosts boot through DHCP, filesystem through NFS – extendable to many hosts • Connections through SSH • PVM (Parallel Virtual Machine) • PVM works also on li1 and li2.
Parallel processing • The use of parallel processing (PVM) speeds up our calculations significantly. • A very powerful tool – where to use it ? ?
Simulations, how/what we calculate • MCNPX code v. 2.4.0 (on Linux, parallel computing) • Input : • setup geometry • starting conditions • Output 1: • neutron distribution • Cross-section libraries (Au, Al - ENDF; Bi - experimental; Iodine - ?) • Output 2: • masses of produced elements or B-values
Influence of the setup parts No walls • Concrete walls : • Neutrons are moderated and reflected back Walls
ENERGY + TRANSMUTATION • INFLUENCE OF THE SETUP PARTS • simplifications of the setup description • different parts of the setup • SYSTEMATIC ERROR (not accurately known exp. conditions) • beam geometry • reactions with protons • inserted detectors • ACCURACY OF SIMULATION • intra-nuclear cascade model used in calculations • PARAMETERS OF THE SETUP • the number of produced neutrons (spallation, fission, ..) • k (criticality)
Control detectors for studying the setup - with (n,g) we study LE neutrons (flat part) – odd numbers -(n,4n) threshold is 23 MeV – even numbers
The influence of setup parts • We cannot remove some things from the setup and measure. • Simulations help us understand what would happen if we did that.
The simplifications of the blanket • No influence on high energy neutrons (even numbers) • Box has no influence on HE neutrons ! • Box blurs differences. • 40%, 10%
Polyethylene, Cd layer • The spectra were taken inside the 1st and 3rd gap. • No influence on HE neutrons. absorption done by238U resonance capture
Aluminum and iron holders, upper iron plate • Two simulations with and without Al, Fe components. The results do not differ outside the limits of statistical error - (HE 3%, LE 10%) • The upper iron plate reduces the number of neutrons for 2%.
The wooden plate • Wooden plate under the target(1+2cm,0.5kg/l). • Without box. • Detectors from top to bottom. • Asymmetry 5% => negligible wood influence.
Systematic error • Systematic error may be done, because we can/did not measure all the experimental conditions. • Simulations give us the estimation of the error. • In simulations we vary experimental conditions in limits of the accuracy with which we measured them.
Beam parameters influence • Beam profile is approximated with Gaussian distribution (good only near the beam center !). • We must always count with beam displacement. • Experimentally determined beam profiles and displacement (V Wagner using monitor and track detector data – for profile mainly I Zhuk data):
Beam profile • Simulations with 3mm, 3cm homogenous beams and with a beam with gaussian profile (FWMH=3cm). • Differences only for few percents. • Not important.
Beam displacement • Beam displaced for 3,5,8, and 10 mm. • Differences between results up to tens of %Displacement must be measured as accurately as possible !
The influence of protons • Activation detectors could also be activated by protons. • Cross-sections for reactions with protons are not included in MCNPX. • Estimations from Phasotron experiment and neutron/proton ratio : in gaps, near the central axis ca. 10% of activation is due to protons.
The influence of detectors on neutron field • Metal plate on top reduces the number of neutrons only for 2%. Our detectors are much smaller. • Golden strap (2mm, 4mm) in the first gap has no influence on detectors in other gaps. • Only 0.1 mm thick golden strap is an obstacle for thermal neutrons : it can reduce the production rates of reactions with thermal neutrons inside the same gap for 20%.
The influence of plastic foils for detectors on neutron field • The 4mm and 8mmpolyethylene on which were placed the detectors for 1.5 GeV experiments had effect on LE neutrons. • Au in sandwich of 2 Bi foils => no influence.
Intra-Nuclear Cascade models • In MCNPX are 3 models (above 150 MeV): • Bertini • CEM • Isabel • The differences are up to 50% (standard, our detectors).
Experimentally we cannot measure these. For 1.5 GeV experiment, neutron production : 29 in nuc. Interactions 8 in (n,xn) 14 prompt fission. Together 54 neutrons per 1 proton. Without box 49 neutrons, box reflects back 10% of them. KCODE calculations for criticality : k=19.2% k was calculated also by S.R. Hashemi-Nezhad - 22%. If we add polyethylene wall at the back, k stays the same. Neutrons per proton, criticality,..
Neutrons per proton with beam energy • Neutrons per 1 proton and per 1 MeV in the beam • Box adds ca. 5 neutrons • Saturation • Peak at 1500 MeV
Comparison with the experiment • The Greek group measures the ratios of neutrons inside and outside the box. • Calculated results do not agree with experiment. • Possible reason...
Group from Řež • 4 detector types • A lot of cross-section libraries • Trends in ratios experiment/simulation are seen • 3 GeV experiment would confirm these trends
Comparison between experiment and simulations 194Au 196Au Longitudinal distribution Radial distribution
6 MeV 8 MeV 11 MeV 23 MeV 23 Mev 23 MeV 23 MeV 11 MeV 8 MeV 6 MeV Experiment: Ep = 1.5 GeV 0.7 GeV, 1.0 GeV - the similar shape of radial distribution for experiment and simulation 1.5 GeV-different shape of radial distribution for experiment and simulation Cleardependenceon reaction energy threshold ↔on the neutron energy ratios normalized on first foil Longitudinal distribution – small differences, maybe done by not included protons Radial distribution– big differences, description is worse for neutrons with higher energy
Radial distribution for 0.7 GeV and 1.0 GeV Conclusions: • Very small differences of shape • Maybe increase with energy? Necessary systematic of experiments with different beam energy Dependence of EXP/SIM ratios for first radial foil on beam energy Very important: 1) To analyze 2 GeV experiment 2) To make 3 GeV experiment