Download
1 / 16
200 likes | 304 Views
Understanding the energy transfer between the ocean and atmosphere is vital for diabatic heating/cooling. Explore the effects of sea-air fluxes, hot towers, hurricanes, and cyclones on atmospheric processes and tropical circulation dynamics.

E N D
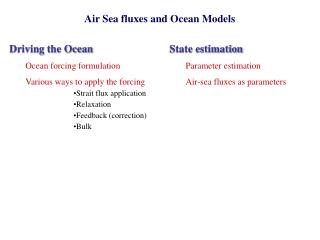
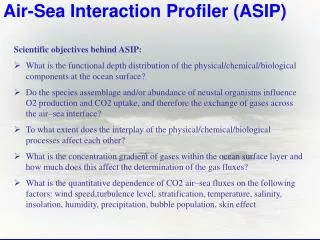
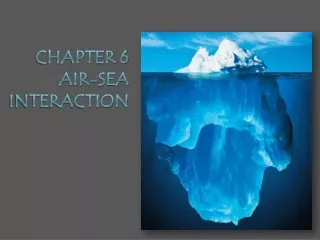
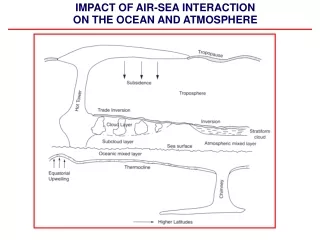
IMPACT OF AIR-SEA INTERACTION ON THE OCEAN AND ATMOSPHERE
The transfer of energy between the ocean and the atmosphere provides diabatic heating/cooling of the atmospheric and oceanic boundary layers. In the atmospheric boundary layer the effects of sea-air fluxes on the processes depend on the balance of TKE: Production of TKE by buoyancy (+/-) (reversible) Mechanical production of TKE (normally positive)
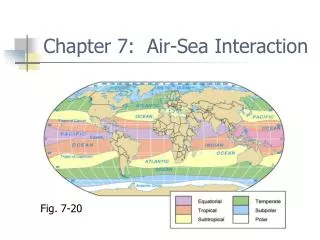
Tropics: buoyancy term dominates (hot towers and hurricanes) Hot towers (Malkus 1958): analysis of the distribution of the moist static energy: Processes in the clouds which fill the atmospheric mixed layer between the lifting condensation level and the trade inversion Total static energy vs height in the tropics: the greatest energy deficit is just above the trade inversion
Release of latent heat turns the central cores of cumulonimbus into hot towers and generates fast ascent in them. Towering is butting against the trade inversion. Hot towers perform the mechanism of drying the air. Saturation water vapor pressure ez is the function of temperature: ez = f(T).Changes of temperature and pressure of the moist air rising in the hot tower: Adiabatic lapse rate Hydrostatic balance
The ratio e/P is constant in the sub-cloud layer, so that the vapor pressure changes track total pressure. However the saturation vapor pressure changes with temperature: where Lv, Rv stand for the water vapor characteristics. Assuming small proportional changes in the absolute temperature, integration gives: For the mixing ratio: assuming the pressure to be hydrostatic:
Elimination of temperature and mixing ratio gives basic gradient relationships: LCL Temperature and mixing ratio profiles in the hot tower
Hot towers provide important mechanism of the low layer – higher layer exchange of energy in the tropics and maintenance of large scale tropical circulation and trade inversion, that leads to the formation of ITCZ. General scheme of the tropical processes
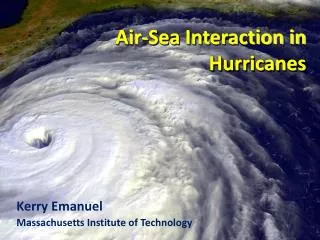
Hurricanes are the representatives of the hot towers over the ocean, the most remarkable features of the drying air process. Holland’s empirical formula: P=Pc+(Pn-Pc)× × exp(-R/r)b Pn is external pressure Pc is eye pressure R is radius of max wind A schematic vertical section of the hurricane
Katrina, 2005 Dean, 2007 Felix, 2007 9
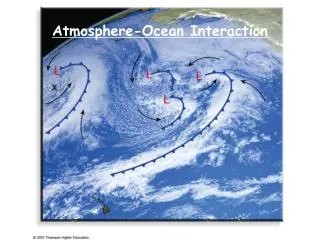
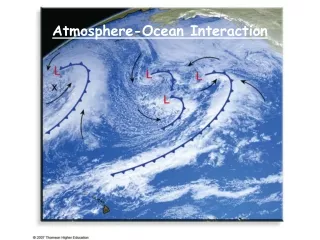
Mid latitudes: wind share and buoyancy work together – extratropical cyclones Linearized potential vorticity equation: Q is diabatic heating, S is static stability. Prognostic omega equation: with~p/u, ~L/U, h~1/p. Two unknowns: perturbation of steam function and perturbation of vertical velocity are forced by the heating from below. What is changed is the generation of available potential energy and the rate of its transformation to kinetic energy cyclone vorticity grows, new cyclones can be generated. Most remarkable example: cold/warm air outbreaks.
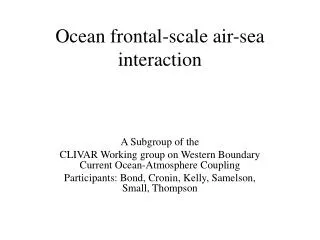
Tair SST warm cold In the back part of the cyclone propagating over the GS front, cold and dry Arctic air masses are advected over the relatively warm water (cold-air outbreak). In this case the largest sea-air temperature differences are observed exactly over the SST front due to much smoother spatial temperature gradients in the atmosphere in comparison to the ocean. South of the SST front thermodynamic adjustment works to decrease the air-sea temperature and humidity differences. In the forward part of cyclone the advection of the moist and warm air to the north (warm air outbreak) results in the local decrease of surface fluxes, associated with the advective fogs and strong vertical motions in the lower 100-200 m layer of the atmosphere.
FASTEX MOVIE SCRIPT The Front and Atlantic Storm Tracks EXperiment called FASTEX was an ambitions project, being the first to attempt to provide detailed observations throughout the entire life cycle of a set of extratropical cyclones during January and February 1997. The Couplage avec l'ATmosphère en Conditions Hivernale experiment called CATCH was the oceanic component of FASTEX. CATCH was performed in the Newfoundland Basin, a region characterized by a strong Sea Surface Temperature front of 0.4°C/km associated to the Gulf Stream and the North Atlantic Current. As the Sea Surface Temperature gradients are maintained all throughout the year, even in winter, this surface oceanic structure is a favourable environment for triggering atmospheric cyclogenesis, explosively deepening cyclones and frontal waves. The complex influence of turbulent fluxes on cyclone properties and cyclogenesis is a not resolved question, and this movie aims to contribute to a better understanding of the role of Sea Surface Temperature (SST), and surface fluxes in the dynamics of oceanic cyclogenesis. The Intensive Observing Period 15 of the FASTEX experiment was selected because the surface pressure of the atmospheric low strongly decreased when the perturbation crossed the SST front associated to the North Atlantic Current from cold to warm water. Three simulations of 36 hours each were performed with the non-hydrostatic model Meso-NH between the 13th of February 12 GMT and the 15th February 00 GMT : the first one with a realistic SST field describing in detail the oceanic fronts associated to the Gulf Stream and the North Atlantic Current systems; the second one with a uniform cold SST equal to 3°C and the third one with a uniform warm SST equal to 15°C. These uniform SST fields correspond to the mean surface temperatures of the Labrador and Gulf Stream currents, and simulate the extreme surface conditions for a cyclone traveling only on cold and warm water, respectively. The colored background is the potentiel temperature, the arrows represent the wind and the solid line in the Real case marks the surface oceanic front. Cold and warm water are respectively west and east of this line.
- In the Real SST case, the wave is well developed with marked temperature and wind discontinuities in the cold front and the occlusion. • - In the Cold SST case, the temperature and wind horizontal gradients and the wind intensities are significantly weaker than in the Real SST case. • In the Warm SST case, the cold atmospheric front develops much weaker activity than in the Real and Cold SST cases, but has an occlusion and a much more intense low than in the other two cases. Consequently, we can see that the oceanic cyclones respond very differently in the three SST cases. • In the Real SST case the cold front develops stronger intensity compared to the two other cases because of enhanced differential thermal advection on both sides of the cold front. A local effect of the cold water on the frontogenesis can be seen in this zoom. Here the cold water stops the eastward progression of the cold front that locally increase the differential advections and thus the frontogenesis, like a coil spring in compression. • In the Warm SST case, the cold front is almost non-existent because the warm SSTs break the cold advection behind the atmospheric cold front and therefore the differential thermal advection across the cold front that generates its degeneration. • The central part of the wave is very intense because of a massive warm advection in the warm sector and in the core of the perturbation that induce a vigorous extension in latitude of the atmospheric wave. Finally, the perturbation is reduced to a large vortex in which two lows can be identified: the system seems to evolve towards tropical-cyclone characteristics. • Heavy precipitation corresponding to rainfall rate greater than 8mm/h, (here in red pixels) is obtained in the Warm SST case and is mainly produced by the convective part and not by the stratiform part. Consequently, warm SSTs significantly enhance only the convective activity of the wave.
In the Real SST case, it is noteworthy and unique to see the explosion of the surface net heat budget when the atmospheric wave reaches the warm water. The important point here is the strong spatial discontinuity in the surface net heat budget appearing when the occlusion is in phase with the oceanic front. This sharp horizontal gradient plays an important role in the occlusion intensity. In the Cold SST case, this frontal discontinuity never exists and the surface net heat budget is negative everywhere negative meaning that the perturbation gives up energy to the ocean. In the Warin SST case, the surface net heat budget is positive everywhere, meaning that the ocean strongly supplies the atmosphere in energy. Note that even without the oceanic front, the surface net heat budget shows particularly strong variations in the occlusion We conclude that the "Warm" cyclone doesn't work the same way the "Real" one. The surface stress has the same behavior as the surface net heat budget and the highest intensities are found along the occlusion where the instability is maximum. The surface stress explosion occurs especially in the Real SST case when the occlusion enters into phase with the oceanic front. Impacts of the SST front on the vertical distribution of the buoyancy flux is shown at 12 and 15 GMT. Near the surface, the strong intensities are clearly driven bye the oceanic front line, specially in the occlusion zone. To these strong low-level intensities are associated strong negative values at the boundary layer top. Consequently, the SST’s also drive the entrainment processes In the Cold SST case, it appears that the flux is close to zero everywhere and often negative, meaning that the perturbation loses energy to the ocean. As consequence, we find lower boundary layer depths.
The main characteristic of the Warm SST case is in the strongest intensities of the buoyancy flux behind the atmospheric perturbation, in the region of the cold-air outbreak. This is because of cold air advected from the northwest above the very warm SST in this area. Maxima surface stresses are found along the occlusion where the instability is maximum. This instability and thus the maxima are enhanced by the fact that the occlusion and the SST front are phased. In the Cold SST case, SSTs stabilize the boundary layer that induces weak momentum transfers everywhere. The strong low-level instability induced by the massive warm advection in the occlusion produces stronge momentum exchanges in the boundary layer. The main aim of this study is now to analyze how the spatial variability of the buoyancy and the momentum fluxes partly induced by a change in SST, can effect the frontogenesis and cyclogenesis in the Marine Atmospheric Boundary Layer. In the Real SST case, the total frontogenetic forcing vigorously increases the dynamics of the cold front and the occlusion, whereas in the Cold SST case, the frontogenetic forcing is not so intense and organized, especially in the occlusion. Therefore, in the cold SST case, the cold front evolves towards weaker activity than in the Real SST case and the occlusion is almost non-existent. In the Warm SST case, the frontogenetic forcing completely collapses in the cold front when this source is particularly strong in the occlusion. The advective comportent (FQtw) is the strongest compotent of the frontogenetic function and proves that the differential thermal advection is the main source of baroclinicity in the fronts of the perturbation. This forcing is modulated by the SST in the same way as the frontogenetic function, specifically in the cold front and the occlusion. In the Real SST case, the buoyancy component (FQth) is clearly positive in the oceanic front area. In the occlusion, the buoyancy flux induces a marked frontogenesis because of the phasing between the SST front and the occlusion, whereas in the Warm SST cases the buoyancy flux forcing is strongly frontolytic. In the Real SST case, the positive sources of vertical velocity are well marked in the frontal lines. In the Cold SST case, these sources vanish quite everywhere, and in the Warm SST case, there is no production of ascent motion in the cold front. All the production is limited in the core of the wave and particularly in the descent branch of the occlusion where the thermal advection source is preponderant.
In the Real SST case, the positive sources of vertical velocity are well marked in the frontal lines. In the Cold SST case, these sources vanish quite everywhere, and in the Warm SST case, there is no production of ascent motion in the cold front. All the production is limited in the core of the wave and particularly in the descent branch of the occlusion where the thermal advection source is preponderant. In the Real SST case the positive sources of frontogenesis and vertical velocity are reinforced by SST gradients whereas in the Warm SST case they are boosted by convection because it increases low-level convergence. So in the Real and in the Warm SST cases, the occlusion activity is derived from different origins. Horizontal sections of the wind speed greater than 30m/,s show the presence of a Low-Level Jet in the occlusion near 600m above the surface. The baroclinicity in the occlusion increases precisely when it is phased with the oceanic front. This configuration of the oceanic and atmospheric systems generates a marked Low Level Jet as shown in the latitude and longitude sections. In the Cold SST case, the Low-Level Jet decreases strongly because of a weaker baroclinic zone which relaxes the thermal wind along the occlusion. In the Warm SST case, the baroclinic zone in the occlusion is enhanced by the convection and not by the buoyancy flux as shown by the frontogenetic function. Consequently, the Low-Level Jet displays the strongest values in this case, but is not of the same origin as in the Real case. As for the wind speed, the relative vorticity becomes high when the perturbation arrives in the SST gradient. Moreover, the iso-surface 7.5e-4s-1 reaches the ground in the oceanic front and takes off after. This behavior highlights the surface diabatic effects in the production of vorticity spinup and vertical velocity. This study shows a complex thermal and dynamic structures in the Marine Atmospheric Bondary Layer when oceanic and atmospheric fronts are in interaction. Specifically in the Real SST case, the SST front plays a fundamental role in occlusion development while in the Warm SST case, the convection and the latent heat release mainly drive the frontal dynamic of the occlusion. In the Cold SST case, cold water stabilises the low levels and induces a weak cyclogenesis. Consequently, the SST is really able to induce and modulate mesoscale thermal and dynamic structures within a cyclone.