Download
1 / 32
320 likes | 497 Views
M. J. Wiley & M. Omair School of Natural Resources and Environment University of Michigan, Ann Arbor. Applications of GIS to River Management: Recent developments in the Great Lakes Basin. Why are we here? To learn about research and conservation activities in the Gangan Basin

E N D
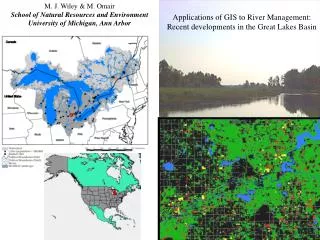
M. J. Wiley & M. Omair School of Natural Resources and Environment University of Michigan, Ann Arbor Applications of GIS to River Management: Recent developments in the Great Lakes Basin
Why are we here? • To learn about research and conservation activities in the Gangan Basin • To explore possibilities of collaborative research focusing on River Ecosystem Management
Ganga Watershed St. Lawrence Watershed Percent 80 60 40 20 0 Percent 80 60 40 20 0 Land cover within 5km of the river Land cover within 5km of the river Crop Developed Forest Shrubland Grassland Barren Crop Developed Forest Shrubland Grassland Barren
The ecological complexity of large river systems and the many, inter-related impacts of our own societies on this ecology, make practical management and restoration activities in large rivers particularly difficult Applications of GIS to River Management: Recent developments in the Great Lakes Basin What Is GIS? Geographic Information System Spatially explicit relational database system and mapping tools • Ecosystem Management Approach: GIS plays a central • Classification frameworks for regional Ecological Modeling, Inventory & Assessment
Ecosystem Management Approach: • Wholistic, Collaborative, Stake-holder Sensitive River Planning and Management
MREMS website(s) rivers.snre.umich.edu/mrems_www/index.htm www.gvsu.edu/wri/isc/
2. GIS-linked Computer modeling provides one tool for regional river-based planning and management: Muskegon River and Grand Traverse examples • Regional landscape-scale modeling (raster cover modeling) • Ecological Unit Classification and Regional River Mega-modeling
Simulated Water Table Elevations Model provides a reasonable prediction of USGS measured heads Courtesy Drs. B. Pijanowski and D.Hynman, MSU
Linked Model Can Explore Changes in Water Table Elevations Due to Land Use Change Influence of Land Use Land Use Change (40 years) Changes in recharge rates may affect regional gradients Decreased heads due to lower recharge rates in urbanizing areas Courtesy Drs. B. Pijanowski and D.Hynman, MSU
Simulated Nitrate from Agriculture 10 years 50 years Concentration (mg/l) Courtesy Drs. B. Pijanowski and D.Hynman, MSU
Michigan Rivers Inventory VSEC units MAP 2. Ecological Classification frameworks for regional Ecological Inventory, Modeling and Assessment 280 main stem river segments and 2000+ tributary units [mri-vsec v1.0]
What is Ecological Classification? Identifying the “fundamental units of nature” (Tansley 1935) Biological character Geomorphic character Integrated multi-factor [Ecological] Character of a River Segment Hydrologic character Chemical character
structural and functional units of river ecosystems • Functional Ecosystem Units • Watersheds • { = Landscape (Regional) ecosystems? } Structural Ecosystem Units The relatively homogeneous river segments we encounter having distinctive biology, temperature, chemistry, etc.; Valley Segment Ecological Unit = Biogeocoenose = Ecosystem type these are local structural expressions of functional watershed units
Raisin River mainstem units
Example applications: regional inventory Basin-wide hydrologic assessment of classification units useful for regional fisheries resource And water quality planning Lake Michigan Tributary Systems
Example application: River Otter (Kotanchik 1997) MDNR Trapping record PCB threshold Hg threshold
Otter and contaminant data aligned on MRI-VSEC segments Otters present high trapping success PCB contaminated Hg contaminated both
Logistic modeling of Otter distribution Logistic Regression Results Prediction success: 83% Primary predictors: - Extreme hydrologies - PCB contamination - Urban development - Ag development + conifer forests Using moderls to plan restoration
Regional River Mega-Modeling links raster, and VSEC unit modeling, and data inventories into an integrated, GIS compatible Decision Support System 1820 1995 2020 2040
MREMS VSEC Modeling framework Valley Segment Ecological Classification Unit (Seelbach et al. 1997) All raster and watershed modeling input & output is referenced to the VSEC channel units map and can be displayed in GIS format Integrating raster and channel based models In a GIS framework yields a powerful tool For planning and comunication
An illustration, from the current Muskegon River study, of our method for linking valley scale ecologicalclassification (VSEC) units to landscape sensitive models. A..Sample sites are used to represent the entire VSEC unit theyoccur in, based on the mapping objective of ecological homogeneity. B.VSEC unit ID # is used to geo-reference andquery the associated catchment, buffers, site databases etc. C. Query results are used as inputs for regional models ofrelevant processes as illustrated here for soluble phosphate load. All segments are processed simultaneously in a matrixmodeling environment. Once modeling is completed predicted results are mapped back into the GIS using the VSECspatial framework. Coupled to changing input data sources on landcoverdistributions, this process can generate bothforecasts and hind-casts of ecological status.
50 40 30 20 10 0 past present future Soluble P per day at high flow (g/d) River classification based assessment and modeling techniques retain high spatial resolution across large regional assessments, and are being used by The Nature Conservancy to map the entire Great Lakes Basin for conservation planning; by the USGS Aquatic GAP Program for the Great Lakes Basin; also in a new Three-State Regional Assessment Project; and in Muskegon River Basin Initiative.
The same modeling approaches can be used to organize and interpret biological resource inventories and to identify future risks to river biodiversity
Why are we here? • To learn about research and management activities in the Gangan Basin • To explore possibilities of collaborative research on River ecosystem management
Generalized Methodology Inventory and Data compilation Landscape analysis leading to regional modeling Ecological Classification Modeling of reference condition Status Assessment Risk Assessment
An illustration, from the current Muskegon River study, of our method for linking valley scale ecologicalclassification (VSEC) units to landscape sensitive models. A..Sample sites are used to represent the entire VSEC unit theyoccur in, based on the mapping objective of ecological homogeneity. B.VSEC unit ID # is used to geo-reference andquery the associated catchment, buffers, site databases etc. C. Query results are used as inputs for regional models ofrelevant processes as illustrated here for soluble phosphate load. All segments are processed simultaneously in a matrixmodeling environment. Once modeling is completed predicted results are mapped back into the GIS using the VSECspatial framework. Coupled to changing input data sources on landcoverdistributions, this process can generate bothforecasts and hind-casts of ecological status.
Land Transformation Modeling Project Simulate Human Impact Scenarios • Does urbanization alter hydraulic head? • What does the future look like?
Au Sable River mainstem units
Ecological Channel Units [MRI_VSEC v1.1] Muskegon River Lake Michigan Drainage ~2900 square miles • I.Upper River • 42 vsec units • characteristic fishes • pike • rock bass • Excellent salmonid tribs • Clam • Hersey • Bigelow • Cedar • II. Mid River • 46 vsec units • characteristic fishes • walleye (Smb, burbot) • brown trout seasonal III. Lower River; 19 vsec units: pretty much everything