Download
1 / 62
620 likes | 646 Views
This study examines agricultural development and disparities in Asian countries, emphasizing the need for balanced human resource and crop productivity improvement. It discusses the use of composite developmental indicators for multi-dimensional analysis and offers insights on measuring country-level development using statistical data.

E N D
STATISTICAL EVALUATION OF AGRICULTURAL DEVELOPMENT IN ASIAN COUNTRIES V.K. Bhatiaand S.C. Rai Indian Agricultural Statistics Research Institute Library Avenue, Pusa, New Delhi – 110 012,INDIA
Introduction • Agricultural development is a continuous process of improvement of crop and livestock production. • The improvement in agricultural sector and commendable progress in industrial front have Increased the total production in agriculture and manufactured goods, but there is no indication that these activities have been able to reduce substantially the level of regional disparities in terms of development.
Development in the farm sector requires a balanced human resource development as well as the improvement in crop productivity. In most of the Asian countries, some agricultural developmental programmes are initiated for enhancing the productivity of various crops and thus improving the social and economic positions of the people.
For focusing the attention of scientists, planners, policy makers and administrators on the problems of estimation of level of development, a series of research investigations were carried out for different regions. The studies revealed that there were wide disparities in the level of development among different regions of study.
Developmental Indicators Development is a multi-dimensional process. Its impact can not be captured fully by any single indicator. A number of indicators when analyzed individually, do not provide an integrated and easily comprehensible picture of reality. Hence there is a need for building up of a composite index of development based on optimum combination of various indicators.
Application of Developmental Indicators Developmental Indicators provide simple comparisons of regions that can be used to illustrate complex and sometimes elusive issues in wide ranging fields, e.g., agriculture, economy, society or technological development. These indicators often seem easier to interpret by the general public than finding a common trend in many separate indicators and have proven useful in benchmarking region performance.
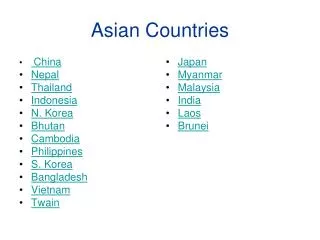
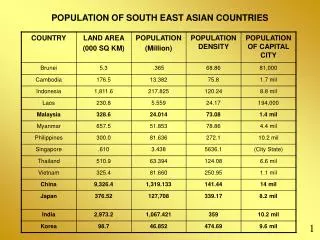
Out of 50 countries in Asia, about 39 countries are contributing towards most of the agricultural produce. All the 39 countries covering more than 99 per cent of population of the continent are included in the study. Agricultural sector plays very important role in enhancing the level of living of people in these countries.
Structural transformation is taking place in some of the countries in Asia for diverting heavy dependency on agricultural sector. These countries are making concerted efforts for promoting industrial growth along with enhancement in farm sector for making self-reliant rural economy through creation of massive gainful employment for the rural population.
However, Developmental Indicators can send misleading policy messages if they are poorly constructed or misinterpreted. The composite indicators may be seen as a starting point for initiating discussion and attracting public interest.
Pros and Cons of Developmental Indicators Pros • Can summarize complex or multidimensional issues into single value (index) • Facilitates the task of ranking • Easy to understand and interpret by public
Cons • May send misleading message if poorly constructed • May be misused • Selection of variables and their weights is very subjective
Indicators used for Evaluating the Level of Agricultural Development (26) • Yield Rate of Total Cereal • Yield Rate of Wheat • Yield Rate of Rice • Yield Rate of Coarse grain • Yield Rate of Barley • Yield Rate of Maize • Yield Rate of Millet • Yield Rate of Sorghum • Yield Rate of Roots & Tuber Crops • Yield Rate of Potato • Yield Rate of Total Pulses • Yield Rate of Beans Dry
Yield Rate of Soybeans • Yield Rate of Groundnut in Shell • Yield Rate of Cotton Seed • Yield Rate of Tomatoes • Yield Rate of Chillies • Yield Rate of Onion Dry • Yield Rate of Garlic • Yield Rate of Grapes • Yield Rate of Sugarcane • Yield Rate of Tobacco • Number of Cattle Per Lakh Population • Number of Sheep Per Lakh Population • Number of Goats Per Lakh Population • Number of Chickens Per Lakh Population
Description of the Data Utilized Data for the present study have been compiled from FAO Quarterly Bulletin of Statistics. 10, 997- 3/4. Statistical Bulletin of SAARC Agricultural Data (2004). SAARC Agricultural Information Centre (SAIC), BARC Campus, Farmgate, Dhaka 1215, Bangladesh. Ed by Mohammad Abdullah.
Importance of the Analysis It would be quite useful to measure the level of development at country level, since there has been a growing consensus about the need of country level comparison at the global scenario. Knowledge of level of development at country level will help in identifying the true status of a given country in relation to others. Each country faces different administrative and economic factors of development unique to its own as well as some global norms in the presence of world trade.
Methods of Analysis • Development is a multi-dimensional process which is continuous in nature. • There are several methods for estimating the level of development but most of them are having their own limitations. • The major limitation arises from the assumptions made about the developmental indicators themselves and their weightage in aggregate index.
Composite Developmental Index • Composite Developmental Index is like a mathematical and computational model • Construction is an art and not entirely based on universally accepted scientific rules • Justification of index lays in its fitness to the intended purpose • It should have a wider acceptance by policy planners, public and researchers
Criteria in Construction of Index • Theoretical frame work for selection of variables • Robustness and sensitivity • Weighing and aggregation • Normalization • Avoid adding apples and oranges • Data selection • Analytical Soundness • Measurability • Relevant • Relationship among themselves
Earlier Methods Employed for Construction of Developmental Index • Principal Component Analysis • Multiple Factor Analysis • Aggregation Method • Monetary Index • Ratio Index • Ranking Method • These methods have, however, some limitations in application to different situations for handling categorical, ordinal and ratio scale data.
Limitations of Old Methods • Principal Component Analysis • Mostly ‘factor analysis’ approach is used. • Based on restrictive assumptions regarding the developmental indicators. • Assumes that the variable indicators are linearly related. • When non-linearity is present, the component analysis is not appropriate. • Further, one cannot assign any special meaning to the transformed variables with respect to socio-economic development. • Artificial orthogonal variables, not directly identifiable with a particular economic situation.
Multiple Factor Analysis • The main advantage is that the ‘factor loading’ can be used as weights for combining the effect of various indicators. • This method avoids, to some extent the arbitrariness in choosing weights. • But it does not serve the purpose to arrive at a meaningful and comparable composite index of development when the indicators are presented in different scale of measurements.
Aggregation Method • Simple addition of the values of the developmental indicators is taken as composite index of development. • The method is not suitable as the composite index of development obtained by use of the method depends on the unit in which the data are recorded.
Monetary Index • Developmental indicators are converted into monetary values and total of these values is taken as the composite index of development. • Monetary values of developmental indicators may change from place to place and from time to time. • In this way this method affects the composite index adversely. • Major difficulty is that all the indicators cannot be converted into monetary values. e.g. ‘death rate’ , ‘birth rate’, ‘sex ratio’, literacy rate’ etc.
Ratio Index • Developmental Indicators are transformed as ratio in the following manner: • Sum total of Yi is taken as the Composite Index of Development. • The method uses Range Value in the denominator, which is based on only two observations. • Other information is not utilized in this method.
Ranking Method • Each unit is allotted ranks based on different developmental indicators. • Sum of ranks for all the indicators of the unit is taken as the composite index of development. • Ranking procedure does not take into account the magnitude of differences between indicators and units.
Proposed Method of Estimation of Composite Index of Development Keeping in view the limitations of the above methods, the following statistical procedure for estimation of composite index of development is adopted in the study. Let be the data matrix. i = 1, 2, . . . n (Number of area unit) j = 1, 2, . . . k (Number of indicators)
Sincecome from different population distributions and they might be recorded in different units of measurement, they are not quite suitable for simple addition for obtaining the composite index. Therefore, are transformed to as follows. = mean of the jth indicator. Sj = standard deviation of the jth indicator. where is the matrix of standardized indicators.
From , identify the best value of each indicator. Let it be denoted by Zoj . The best value will be either the maximum value or minimum value of the indicator depending upon the direction of the impact of indicator on the level of development. For obtaining the Pattern of Development, calculate Pij as follows. Pattern of development Ci is given as where (C.V.)j is the coefficient of variation of the j-th indicator in Xij .
Composite Index Di is given by Di = Ci / C for i = 1, 2, . . . n where = Mean of Ci and SDi = Standard Deviation of Ci Smaller value of Di will indicate high level of development and higher value of Di will indicate low level of development.
The distance between countries i & p is given by dip where i = 1, 2, 3,…, n p = 1, 2, 3,…, n Here dii = 0 and dip = dpi Now dip can be written as:
Find out the minimum distance for each row. Let the minimum distance for row i is di . Obtain the critical distance (C.D.) as follows: where = mean of di and sd = standard deviation of di
Results and Discussion • The composite index of agricultural development has been calculated for different countries. • The countries have been ranked on the basis of composite indices. • The composite index of agricultural development along with the rank are presented for different countries
Composite Index of Agricultural Development and Rank of the Country
The composite indices varied from 0.41 to 0.84. • China is found to be the best agricultural developed country in Asia whereas Bhutan is in the last place. • China, Japan, Kuwait, Saudi Arabia and United Arab Emirates are observed to be the best five developed countries. • Bhutan, Cambodia, Kazikistan, Turkemenistan and Nepal are the last five developed countries in the continent. • Wide disparities in composite indices of agricultural development have been observed among different countries.
Different Stages of Development For relative comparison of different countries with respect to agricultural development, classify the countries as:
Countries having the composite indices less than or equal to 0.59 are highly developed and put in stage I of development. • Countries having composite indices greater than 0.79 are low developed and these are classified in stage IV of development. • Countries having composite indices between 0.60 to 0.69 are high middle level developed and these are classified in stage II of development. • Countries with composite indices between 0.70 to 0.79 are low middle level developed and these are classified in stage III of development.
Names of Countries and Percentage Population under Different Stages of Development
It may be seen from the above table that • Out of 39 countries included, seven countries are found to be highly developed in agriculture. These countries are thickly populated and cover about 40 per cent of population of Asian countries. • Eight countries are found to be in high middle level developed group. About 12 per cent population of the continent come from these countries. • Nineteen countries are found to be low middle level developed covering about 46 per cent population. • Five countries are poorly developed and these are in low stage of development and cover about 2 per cent population of the continent. Special steps are needed for enhancement of agricultural development in these countries.
Inter-relationship between Different Indicators and Agricultural Development For proper and effective agricultural development, it is desirable that the crop productions and animal husbandry activities should prosper together in the country.
Correlation Coefficients * Significant at 0.05 probability level. ** Significant at 0.01 probability level.
The correlation coefficient between yield rates of wheat and rice is highly significant indicating that the productivity levels of these two crops are positively associated. • The productivity of rice is found to be highly associated with productivity of maize crops. • The productivity levels of wheat and rice are observed to be moderately associated with cattle population in the countries. • Yield rate of total pulses is not found to be associated with the yield rates of wheat, rice or maize crops. • The correlation coefficients between the yield rate of wheat and composite index (Di), yield rate of rice and composite index (Di) are found to be negative and highly significant.
Since higher values of composite index indicate low level of development and lower value of composite index indicates high level of development • The productivity levels of wheat, rice and maize are associated positively with the level of development. • The productivity of total pulses and cattle population are also moderately associated with agricultural development in the positive direction.
Improvements needed in Developmental Indicators of Low Developed Countries • Five countries namely Bhutan, Cambodia, Kazikistan, Nepal and Turkemenistan are found to be low developed in agriculture. • These countries are situated in different parts of the continent having different climatic conditions.
Actual Achievements of Low Developed Countries and Average Performance over all Countries for Different Indicators
Table contd… * Maximum number
It may be seen from the above table that • The present achievements of low developed countries are extremely low as compared to Asian average. • These are found to be much below to the level of average performance of Asian countries in almost all the developmental indicators. • For improving the level of development of low developed countries special studies for estimating the level of development at micro level (district or sub-division level) are required to be conducted in these countries for providing specific location-wise suggestions of improving the status of development.