Download
1 / 27
270 likes | 533 Views
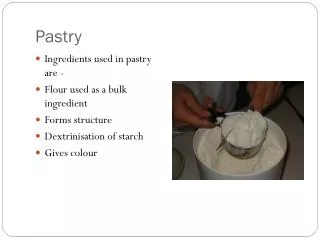
Biz-Café Weekly Marketing Performance Statement With Pastry. Ted Mitchell. Two Classic Accounting Statements. 1) The Income Statement Written as a statement about the flows over the reporting period (week, month, etc.) 2) The Balance Sheet

E N D
Biz-Café Weekly Marketing Performance StatementWith Pastry Ted Mitchell
Two Classic Accounting Statements • 1) The Income Statement • Written as a statement about the flows over the reporting period (week, month, etc.) • 2) The Balance Sheet • Written for the specific point in time, a snap shot of one day’s situation
Note How the Markup is different from the Gross Return on Sales
Marketing Profit Returned on Sales, MROS Marketing Profit Returned on Marketing “Investment” ROME
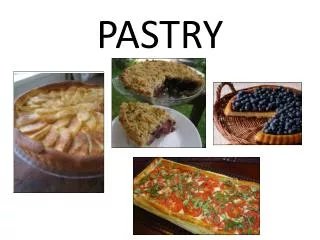
Basic Profit Equation Has Changed • Profit = PQ – VQ – F • Z = PQ – VQ – Ad – Radio – Server Expense • Z = (P – V)Q + (Pp –Vp)Qp – F • Pp = price of pastry, Vp = cost of pastry, Qp = quantity of pastry • What is the relationship between Q and Qp? • Qp = 30%Q • Z = (P –V)Q + (Pp –Vp)(30%)Q – F • Z = (coffee unit profit)Q + (pastry unit profit)(30%)Q – F • Z = ($3.74 + $1.50 (0.3))Q – F • Z = ($3.74 + .45)Q – F • Z = $4.19Q – F
Other Metrics Start to Emerge • For Trends and Diagnostics • 1) Number of Customers/Prospects • 2) Number of Transactions • 3) Transactions per Prospect • 2) Size of Average Transaction (Revenue) • 3) GROSS Profit from Average Transaction • 4) Average GROS per Transaction
Balance Sheet • Traditional Assets • Cash, equipment, accounts receivable • into a statement of Market and Competitive assets • Awareness, customer satisfaction, market share
Weekly Balance Sheet for Week 8 at Sunday Midnight Traditional Balance Sheet
Weekly Balance Sheet for Week 8 at Sunday Midnight Awareness as a Percentage of the Total Population of Potential Customers in the Market
Weekly Balance Sheet for Week 8 at Sunday Midnight Customer satisfaction as a stand alone number is not very useful
Weekly Balance Sheet for Week 8 at Sunday Midnight Relative to Average Customer Satisfaction is Useful
Weekly Balance Sheet for Week 8 at Sunday Midnight Market Share needs to be relative to something to be useful
Compare Balance Sheets Relative to Something is the key to usefulness
Any Questions on the Type of Performance Statement and Balance Sheet that Marketers want?
Sample Exam Questions • 1) You are selling pastry and coffee. The Gross Return on Sales, GROS is equal to the average markup on both products? • True or False
Three Questions • 1) What is the average selling price per sku? • 2) What is the average profit per unit? • 3) What is the average markup per unit sold?
Three Questions • 1) What is the average selling price per sku? • 2) What is the average profit per unit? • 3) What is the average markup per unit sold?
Three Questions Who cares? Nobody! • 1) What is the average selling price per sku? • 2) What is the average profit per unit? • 3) What is the average markup per unit sold?
Three Different Questions • What is the average revenue of the two product categories? • What is the average gross profit for the two categories? • What is the average GROS for the two categories?
Three Different Questions • What is the average revenue of the two product categories? • What is the average gross profit for the two categories? • What is the average GROS for the two categories?
Three Different Questions • What is the average revenue of the two product categories? • What is the average gross profit for the two categories? • What is the average GROS for the two categories?
Three Different Questions Who cares? Everybody! • What is the average revenue of the two product categories? • What is the average gross profit for the two categories? • What is the average GROS for the two categories?
Sample Exam Questions • 1) You are selling pastry and coffee. The Gross Return on Sales, GROS is equal to the average markup on both products? • True or False* • Better Question! • What is the average GROS?
Difference between GROS per Unitand Unit Markup on Price, Mp • Markup on Price is Used for Pricing Individual Products and covering an increase in unit cost • Gross Return on Sales is used more for 1) diagnostic comparisons between marketing performances and • 2) Breakeven Revenue to cover a proposed increase in a period cost 9 advertising sales force