Download
1 / 55
560 likes | 688 Views
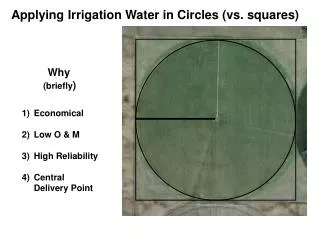
Applying Irrigation Water in Circles (vs. squares). Why (briefly ). Economical Low O & M High Reliability Central Delivery Point. Applying Irrigation Water in Circles (vs. squares). Why it’s a little trickier?. In a circular system the area increases as the radius increases

E N D
Applying Irrigation Water in Circles (vs. squares) Why (briefly) • Economical • Low O & M • High Reliability • Central Delivery Point
Applying Irrigation Water in Circles (vs. squares) Why it’s a little trickier? In a circular system the area increases as the radius increases Hence, each sprinkler applies water to a differently sized Area (A) In a rectangular system each sprinkler applies water to an Identically sized Area (A) 1 2 3 4 2 3 4 1 A1 < A2 < A3 < A4 A1 = A2 = A3 = A4
How Does this Weigh up on a Typical System? (System Capacity = 6 gpm / acre) Circle Area Computations Sprinklers are sized appropriately along length of pivot to maintain uniform applications along linear length of the center pivot machine Area = π R2
How Does this Weigh up on a Typical System? High Pressure
How Does this Weigh up on a Typical System? Medium Pressure
How Does this Weigh up on a Typical System? Low Pressure
Soil / Water Intake Curves 4.0 3.0 1.0 Family 2.0 Intake Rate (in / hr) 0.5 Family 0.3 Family 1.0 0.0 0.0 0.1 0.2 0.4 0.3 0.5 Time (hrs)
Sprinkler Pressure vs. Intake Characteristics Timed Rain Gauge Analysis Thunderstorm Intensity
Sprinkler Pressure vs. Intake Characteristics Timed Rain Gauge Analysis Thunderstorm Intensity Low Medium High Low Medium High
CPNozzle Program New Version • Windows Version • Similar Inputs • Better Visualization • Residue Component • Estimates Surface Storage and Runoff
CPNOZZLE Important Variables • Application Rate • Soil Family • Field Position of Soil Family • Residue Amount • Slope • Sprinkler Radius of Throw RUN CPNOZZLE
CPNOZZLE Example Composite Worksheet
Irrigation System Design (Some Basic Concepts) Don’t Over - Complicate Up Here We Want To Get This FIELD WATER
WATER Irrigation System Design (Some Basic Concepts) Don’t Over - Complicate Up Here We Want To Get This FIELD
Irrigation System Design (Some Basic Concepts) 2 Important Parameters • Flow (most commonly given in gpm) Bucket–Fulls Per Unit Time • 2)Pressure or Head (given in psi or ft. of water) Squirting Distance
FLOW DETERMINATION • Crop / Soil Requirements • a) effective root zone • b) soil texture • 2) Field Size • 3) Water Source Limitations • a) physical • b) by permit • c) other
Crop Requirements (gpm / acre) From NDSU: “Selecting a Sprinkler Irrigation System” General Rule = 6 gpm / acre
(Crop Requirement) x (Field Size) = Flow Requirement EXAMPLE (6 gpm / acre) x (125 acres) = 750 gpm (Not Written in Stone but good guidelines to follow) May also be physical or permit demanded constraints on pumping rate which dictate
PRESSURE or HEAD 4 Main Considerations 1) To offset Elevation difference between source and delivery point 2) To compensate for Friction losses in the mainline delivery system 3) System Operational Requirements 4) Other Minor losses
Elevation Difference between water source and point of distribution Vertical distance between pumping water surface and the field delivery point (for center pivots use the highest point in the irrigated field for conservative calculations) Example 50 feet Surface Water Ground Water
Friction Losses Most friction losses in irrigation systems are developed in the system mainline (transmission pipeline) (Significant friction loss also occurs in the pivot itself but Is usually calculated and included as part of the operational pressure requirements) Transmission Pipeline Most often PVC but may also be aluminum, steel or PE
Friction Losses • Important factors in the calculation pipe friction loss are: • Pipe Inside Diameter (id) • Pipe Material • Pipe Length • Fluid Velocity or Flow Rate Friction loss is typically calculated using one of several common equations: (Hazen Williams equation or Darcy equation)
Friction Losses Hazen Williams Equation H = 10.44LQ1.85 C1.85d4.87 • Where: • H = head loss from friction (ft.) • L = length of pipe (ft.) • Q = flow (gpm) • C = friction factor (140 – 150 for PVC pipe • higher number means smoother pipe) • d = inside diameter of pipe (in.)
Friction Losses Hazen Williams Equation H = 10.44LQ1.85 C1.85d4.87 Example If 750 gpm is flowing through 1500 feet of new 8 inch ID PVC pipe the friction loss will be {10.44 x (1500) x (750)1.85 } / {(150)1.85 x (8)4.87} = 12.3 feet
Operational Pressure Requirements • At the Center Pivot Consist of: • 1) Pressure necessary to operate sprinklers and regulators • satisfactorily (5 psi or greater above rated pressure of regulator) 2) Friction losses incurred in span pipe • Calculation is usually combined together with sprinkler package • spreadsheet • Requirements are commonly given at pivot point location • Elevation differences along pivot may also be included • Example pivot point requirement: • 45 psi @ 750 gpm
Minor Losses The majority of minor losses which will increase the overall head requirement can be caused by: 1) Small friction losses which occur due to fittings and deviations in pipeline alignment 2) Extra losses through pump and suction pipe 3) Friction loss incurred in well tubing 4) Other In large pipeline networks minor losses can be a substantial portion of the total head requirement Typically in irrigation systems minor losses are not a large part of the total head requirement – Often times it is good enough to simply add 5 to 10 feet to the final head calculation as an adjustment for any minor losses which may occur in the system
Example Pressure Totals • 1) Elevation Head = 50 ft. • 2) Friction losses in the mainline • delivery system = 12.3 ft. • 3) System Operational Requirements • = 45 psi or 104 ft. (2.3 ft. of water = 1 psi) • Minor losses estimate = 10 ft. • Total Dynamic Head = 176 ft.
PUMP SELECTION 225 Full Impellor 10% Trim 85% 20% Trim 82% 30% Trim 176 Total Dynamic Head (ft.) 79% 750 0 1250 Flow (gpm)
PUMP SELECTION 225 85% 20% Trim 82% Total Dynamic Head (ft.) 79% 0 1250 Flow (gpm)
PUMP STUFF 1) Pumps DO NOT make pressure (only flow) The system to which the pump is attached creates resistance to flow (pressure) 2) Pump speed is proportional to output (flow) but the head that a pump can resist is proportional to the square of speed. (which means changing speed changes pump flow reasonably but changes head characteristics a whole bunch) (pump affinity laws) 3) Typically slower running pumps are used for low head - high volume applications. 4) Common speeds for irrigation pumps: 1200 RPM (flood pumps), 1800 RPM (sprinklers with moderate head requirements), 3600 RPM (sprinklers with high head requirements).
POWER REQUIREMENTS Horsepower Required = TDH x Q 3954 x n Where n = wire to water efficiency (pump efficiency minus a little - good first guess is .75) EXAMPLE {(176 ft.) x (750 gpm)} / {3954 x .75} = 44.3 hp
CPED PROGRAM • Rewritten for use by NRCS in EQIP program • Evaluates sprinkler package coefficient of uniformity (must be at least 85% according to NRCS sprinkler standard) • Uses pump input parameters to give an entire system evaluation • Sprinkler inputs set up similar to OUTLETS program RUN CPED
IRRIGATION WATER MANAGEMENT By the Checkbook Method • Treats soil profile as a checkbook • Water is the $ • Inputs and outputs are measured or estimated and the balance is tracked throughout the growing season • Can be tracked by hand, in a spreadsheet or with other software
Checkbook Account Transfers Evapotranspiration (Withdrawal) Irrigation (Deposit) Rain (Deposit) Soil Profile (Account Balance) Deep Percolation (Withdrawal)
IRRIGATION SCHEDULING by the CHECKBOOK METHOD NDSU software • Baled Lotus spreadsheet which tracks soil depletion throughout growing season • Estimates crop water use based on daily high temperature input and days past emergence of particular crop • Soil available water inputs are entered at setup • Contains historical weather record for several sites in ND and MN. • Actual soil water measurements can be entered to keep record closer to actual RUN IRRIGATION
EQIP Irrigation Water Management Plan Worksheet Example
1) Plan Purpose / General Details • General statements outlining where the producer is currently at and how he plans to improve his water management through the use of an irrigation scheduling and or crop water monitoring plan. • Open with regards to the producers beginning and ending points. • Producer must implement the use of checkbook type irrigation scheduling by the end of the three year contract as a minimum.
CSP Irrigation Water Management Evaluation Sheet • Evaluates an irrigation system and management scheme for placement/eligibility in the CSP program RUN CSP program
Irrigation Handbook Modifications Located in Section II of EFOTG Chapter 1: Definitions of useful terminiology Chapter 2: Irrigation group classification designations and descriptions (These have changed with this version of the guide) Individual County Soils Classification (in soils section)
Cnty Soils Link
CH 1 link CH 2 link
Electrical Center Pivot Operation • 3 Phase Electric Power so that motors can be easily reversed and consequently the machine will reverse directions • Motor power is 480 V 3Ph, Control power is 120 V 1Ph • Main power supply is delivered to main control panel at pivot point. Control and motor power is delivered to each tower via a 10 or 11 conductor cable mounted on top of span • Timer circuit controls last tower, it runs when timer is activated. The rest of the towers play catch up through the use of micro-switches