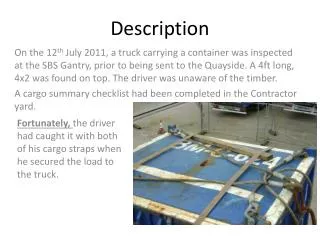
APP DESCRIPTION
APP DESCRIPTION. NON DISCLOSURE AGREEMENT

APP DESCRIPTION
E N D
Presentation Transcript
NON DISCLOSURE AGREEMENT ELC Group Inc. (henceforth The Company) is willing to disclose certain valuable and/or proprietary information to you which may include information about its business, subsidiaries, shareholders and other information (altogether hereinafter also referred to as 'the Company'). The information may include, without limitation, valuable financial, commercial and technical information, know how, inventions and ideas. 1. As a condition to such information being furnished to you, and - if any - your directors, officers, employees, agents, or advisors (including without limitation attorneys, accountants, consultants, bankers and financial advisors) collectively referred to as ‘representatives’, you agree to treat any information concerning the Company as confidential and in accordance with the provisions of this Confidentiality Agreement. 2. You will treat the information as confidential and shall not divulge or disclose any of the information to any third party during your consideration and assessment of the material or at any time thereafter. You will use the information solely for the purpose of preparing a proposal, as well as in the course of any follow up actions for advising The Company and not for any other commercial or other purpose whatsoever. 3. You will not disclose to any third party that you have received information about The Company. You are aware of the fact that any disclosure in this respect could lead to irreparable damage for The Company and its shareholders. 4. You will return all information furnished pursuant to this agreement at first request and will confirm that no information in this respect has been kept by you, except for information, which was already available before you received this information, and except for information, which is deemed to be generally available. 5. Internal dissemination within your organization shall be limited to those employees or directors whose duties justify the need to know such information and then only on the basis of a clear understanding by these employees of their obligation to maintain the secret status of such information and to restrict the use of such information solely to the use specified in paragraph 1. External dissemination and informing and engagement of third parties is only allowed if these parties have co-signed this agreement and after you have informed us of the parties to whom this information has been provided. 6. You will be responsible in any event for any breach of this agreement by you and any of your representatives and you agree, at your sole expense, to take all reasonable measures to restrain your representatives from disclosure or unauthorized use of the information. 7. You will be under no obligation with respect to any information after one (1) year following the effective date of this agreement. 8. This confidentiality agreement shall be governed by and construed in accordance with the laws of Turkey and all disputes arising in connection with this agreement shall only be submitted to a competent court in Turkey, which shall have exclusive jurisdiction. 9. This confidentiality agreement is not a guarantee for a contract between The Company and you
Requirements • It needs to be developed on IOS and Android tablets • Multilanguage ready (English language text will be provided, but we need to be able to supply other languages incrementally without problems) • Development time max 3 calendar months • Source code ownership with me • Table structure is just a recommendation . If a better arrangement is needed feel free to recommend it.
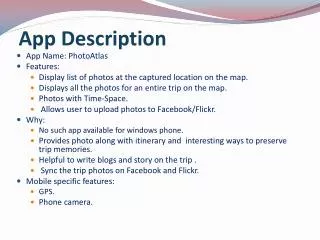
Project • name • Location • Company details • Description • Note • Focus/Improvements Logical view • Process • Name • Description • notes • Components • Value Stream Map • Takt time calculation • Cycle timing observation • Spaghetti chart +distance calculation • PQPR Each Project have multiple processes Each process have multiple components
Versions • As you can see from the data model, many tables have versions • We need versions because datasets need to be compared with each other (i.e. if I time a cycle the first time, then I want to perform some change and take the time again the second time)) • The table t_version stores the basic versions recordset • Sometimes I store previous versions difference in the table / view for easier reference • There is one version per the overall process, not the elements. every time the users wants to change version he will be asked if he wants to update the other elements before moving forward.
Export • All content (project, process, elements, videos) need to be exported to excel / pdf format • Content can be: • Sent via email • Placed on icould, google docs, dropbox and box
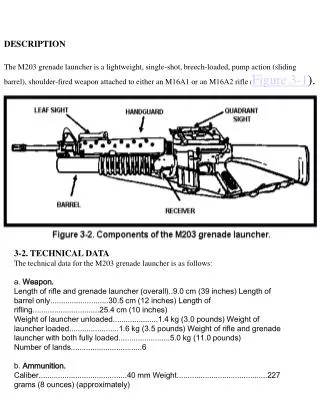
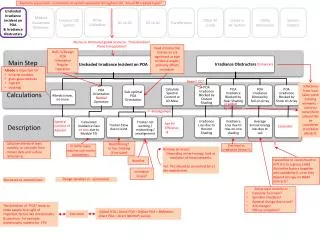
Focus and Improvements page GIVEN A SELECTED VERSION, from the view called v_improvements shows: • A bar chart with the following sql : Select top 10(sum(Adjusted_time)) where project = ‘xyz’ and version =‘3’ (note there is no process, I want to see the top 10 steps for a given project belonging to any process). On the x axis the series are named process name+ step name • A bar chart with the following sql : Select top10(vol_x_time(sum(tot_time from pqpr )where project = ‘xyz’ (note there is no process, I want to see the top 10 parts for a given project belonging to any process). On the x axis the series are named process name+ part name • FOR every process step where sum(Prev_vers_difference_Adjusted_time)>0, group by process, a bar chart showing : • sum(Adjusted_time) Named AFTER • sum(Adjusted_time) from previous version Named BEFORE (alternatively you can use the sum(Prev_vers_difference_Adjusted_time) and calculate tis value) • Process TAKT TIME (from t_Takt time table) as a red line on top. • A table listing process, step, saved cycle time:(sum(Prev_vers_difference_Adjusted_time), and increased throughput Prev_vers_difference_throughput(throughput this version - throughput previous version)
Project Xyz TEXT TEXT TEXT TEXT Cycle time reduction = TAKT TIME
Value Stream mapping • A flowchart connecting the various processes (v_VSM) • Process blocks are t_process records • Possibility to draw flow charts with the selected shapes and connect them to each other • All shapes are measured with a timeline at the bottom of the chart (v_vsm. sum(value adding time, sum(Non Value adding time, Total time = sum(value adding + non value adding time) • Tapping on the individual process boxes brings the user to choose if he she wants to go to timing observation, spaghetti chart or pqpr • TAKT time is displayed all the time.
TAKT TIME CALCULATION Input form: • Shifts per day • Hours / shift • Break time / shift (minutes) • Lunch time / shift (minutes) • Planned downtime/shift (minutes) • Customer demand / shift (units) Stored in the t_takt time table . It measures the pace of customer demand: cycle time must be lower or equal to takt time in order for the customer to be satisfied Formula [(Shifts per day *Hours)- sum(Break time + Lunch time + Planned downtime) ] / Customer demand = TAKT TIME (expressed in seconds, minutes, hours, days)
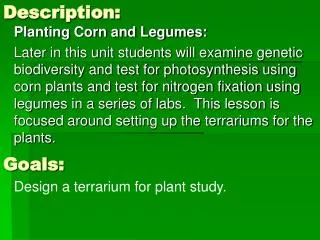
Cycle timing observation • Reference tables are: t_steps, t_cycle time • Initiation: Given a certain project / process, the users defines the process steps (i.e. step 1, 2 and 3) • RECORDING FEATURE : • A: the cycle counter is set to 1, the step is set to 1. The users start recording a video. • B: Upon user input, the step changes to the next one. The time stamp of the start and the end of the step is saved . Alternatively (recommended) when the users move on to the next step, the video stops and it is saved, then a new video recording immediately start. The recording file name is saved in the t_steps table so it can be referenced later. • C: The user continue recording the following steps. When he reach the last step (i.e. step 3 in this example) the step start again from 1 and the cycle counter goes to 2. Then it continue again from point B of this list. • D: When the user is satisfied it presses the STOP ALL And SAVE button. • The recorded video need to show: the time the project, the process the step the operator name • ANALYSIS FEATURE: • The user is presented with a split screen: the upper half is the video with the controls as well as the export function (export to excel with the video files attached as well as export to icloud / google/ dropbox etc.) • The lower part of the screen is an interactive table with the results and it is containing the data coming from t_Steps and t_cycle time filtered by project, process, version. • Users might want to view older versions too, therefore it is important that the videos are saved not in HD resolution but in a resolution that will allow to save enough video. • When clicking on the first cell of each row (i.e. the step number 3 in the next slide) the system should be able to play the videos related to step number 3 in cycle 1 and 2 in parallel at the same time , so that the user can identify variation. More about this here: http://iosguy.com/2012/01/11/multiple-video-playback-on-ios/ http://stackoverflow.com/questions/6828256/multiple-video-same-screen http://developer.apple.com/library/ios/#documentation/AudioVideo/Conceptual/AVFoundationPG/Articles/00_Introduction.html
Cycle timing observation Recording screen Analysis screen Export to excel only / Export to video + excel to cloud, email, dropbox, box,com, google docs VIDEO WINDOW Stop all +Save VIDEO WINDOW Export Version #, CYCLE # . STEP # Start / Restart Record Audio note Editable field Click to play audio note Go to Next step HH:MM:SS Video controls Text: Current Cycle = 1, 2, etc Edit: # operators (2 etc) Click to number play video portion (one step or the whole cycle) Edit: Shift and Names STEP Text: Current step description Possibility to compare different cycles of the same process steps identifying variations
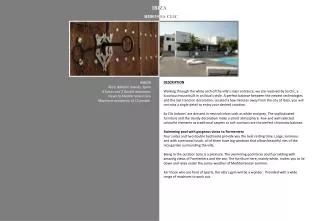
Spaghetti chart • Reference table is t_spaghetti • Several improvement phases (again using versions) • There is always a Baseline version: • The users first draws the background layer: squares and lines, no need to save on db • Then Import process steps from cycle timing observation (using the step_id field) • Then Connect process steps graphically and define distance between steps, distance measure and speed of walking the other fields are calculated.(Previous_step_id, Next_Step_id, distance_previous_step, Distance_next_step, Distance_unit, Travel_speed, travel_unit, Time_to_next, Time_from_previous) • Then the user can start creating one or more improved versions where he or she: • Remove – Rearrange – Move process steps (status field gets updated ) • Renumber process steps therefore changing the sequence • Compare baseline with another version and calculatesaved distance and travel time. • N.B. the saved distance and time is theoretical and it needs to be validated by timing again the cycle using the cycle timing observation element. This data is anyway saved in the version ( Prev_vers_saved_time, Prev_vers_saved_distance) • More on this subject here http://www.slideshare.net/onimproving/how-to-build-a-spaghetti-chart
Spaghetti chart Baseline Current state Future state versions
PQPR (part quantity process route) • A simple table t_pqpr , with a basic record set: • Part number (item code) • Part Description (text) • Demand quantity (number) • % of total (% over total demand quantity) • Each process step description, coming from the timing observation, or defined at runtime • Each process step duration in minutes (also from timing observation) • Step sequence ( first, second etc.) so that the order can be understood. • Total time (calculated per part number) Function: Export to excel, send via email, upload to icloud, box, google docs, dropbox The app will automatically identify the highest volume/highest time steps and color code them (using the t_focusboolean in the table)