Download
1 / 10
100 likes | 107 Views
Explore the alarming rise in drug overdose deaths, focusing on opioids, heroin, and benzodiazepines. Analyze data by gender and opioid involvement, revealing significant increases and key drivers.

E N D
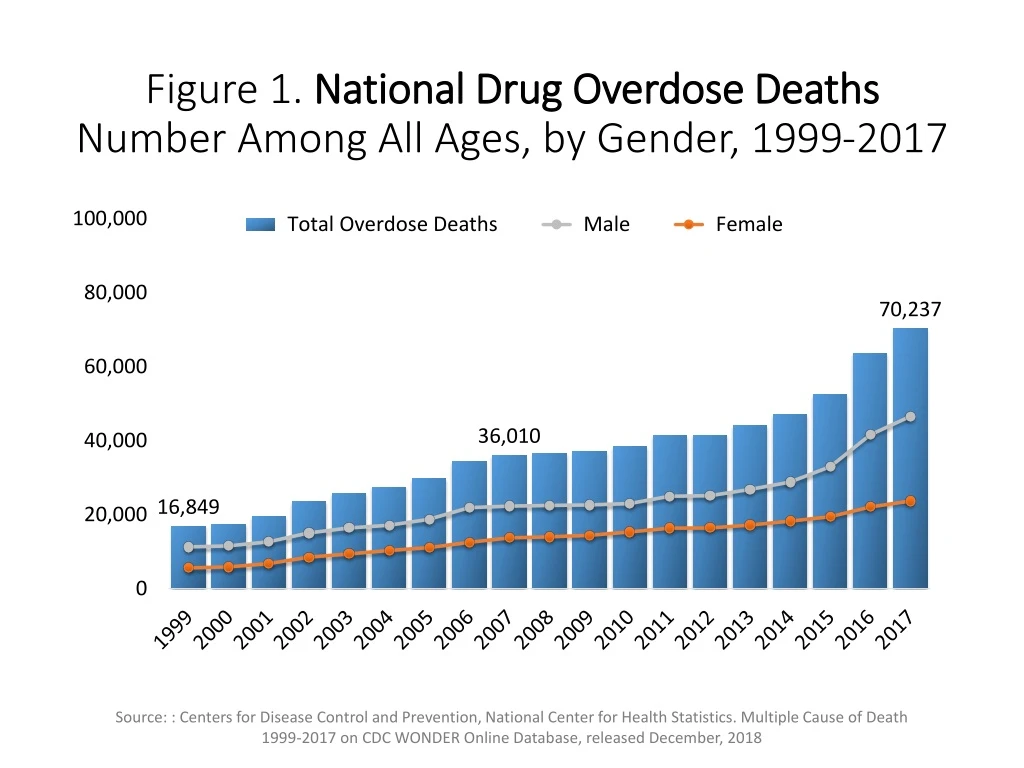
Figure 1. National Drug Overdose DeathsNumber Among All Ages, by Gender, 1999-2017 Source: : Centers for Disease Control and Prevention, National Center for Health Statistics. Multiple Cause of Death 1999-2017 on CDC WONDER Online Database, released December, 2018
Figure 2. National Drug Overdose DeathsNumber Among All Ages, 1999-2017 Source: : Centers for Disease Control and Prevention, National Center for Health Statistics. Multiple Cause of Death 1999-2017 on CDC WONDER Online Database, released December, 2018
Figure 3. National Drug Overdose Deaths Involving Any Opioid,Number Among All Ages, by Gender, 1999-2017 Source: : Centers for Disease Control and Prevention, National Center for Health Statistics. Multiple Cause of Death 1999-2017 on CDC WONDER Online Database, released December, 2018
Figure 4. National Drug Overdose Deaths Involving Prescription Opioids, Number Among All Ages, 1999-2017 Source: : Centers for Disease Control and Prevention, National Center for Health Statistics. Multiple Cause of Death 1999-2017 on CDC WONDER Online Database, released December, 2018
Figure 5. National Drug Overdose Deaths Involving HeroinNumber Among All Ages, 1999-2017 Source: : Centers for Disease Control and Prevention, National Center for Health Statistics. Multiple Cause of Death 1999-2017 on CDC WONDER Online Database, released December, 2018
Figure 6. National Drug Overdose Deaths Involving Psychostimulants With Abuse Potential (Including Methamphetamine), by Opioid Involvement Number Among All Ages, 1999-2017 Source: : Centers for Disease Control and Prevention, National Center for Health Statistics. Multiple Cause of Death 1999-2017 on CDC WONDER Online Database, released December, 2018
Figure 7. National Drug Overdose Deaths Involving Cocaine, by Opioid InvolvementNumber Among All Ages, 1999-2017 Source: : Centers for Disease Control and Prevention, National Center for Health Statistics. Multiple Cause of Death 1999-2017 on CDC WONDER Online Database, released December, 2018
Figure 8. National Drug Overdose Deaths Involving Benzodiazepines, by Opioid Involvement, Number Among All Ages, 1999-2017 Source: : Centers for Disease Control and Prevention, National Center for Health Statistics. Multiple Cause of Death 1999-2017 on CDC WONDER Online Database, released December, 2018
Figure 9. National Drug Overdose Deaths Involving Antidepressants, by Opioid Involvement, Number Among All Ages, 1999-2017 Source: : Centers for Disease Control and Prevention, National Center for Health Statistics. Multiple Cause of Death 1999-2017 on CDC WONDER Online Database, released December, 2018
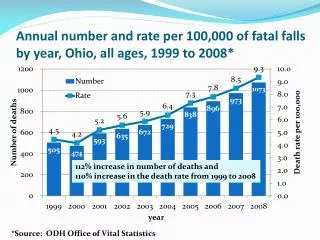
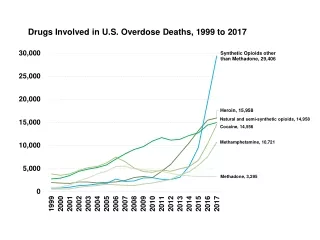
Alternative Text • The figures above are bar charts showing the number or rate of U.S. overdose deaths involving select prescription and illicit drugs from 1999 through 2017. The bars are overlaid by lines representing gender or opioid involvement. There were 70,237 drug overdose deaths that occurred in the United States in 2017 (Figure 1), with 66% of cases among males (grey line). The main driver of drug overdose deaths were opioids―mainly synthetic opioids (other than methadone), with a 12.9-fold increase from 2007 to 2017 (Figure 2). • Drug overdose deaths involving any opioid―prescription opioids (including methadone), synthetic opioids, and heroin―rose from 18,515 deaths in 2007 to 47,600 deaths in 2017; 68% of deaths occurred among males (Figure 3). From 2016 to 2017, the number of deaths involving prescription opioids remained unchanged (Figure 4) with a decrease reported for deaths involving prescription opioids without synthetic opioids. • Overdose deaths involving heroin (Figure 5), psychostimulants (Figure 6) or cocaine (Figure 7) also rose in 2017; however, deaths involving heroin or cocaine were driven by deaths involving the combination of these drugs with synthetic opioids. Deaths involving psychostimulants rose independently from those in combination with synthetic opioids. • The final two charts show the number of overdose deaths involving benzodiazepines (Figure 8) or antidepressants (Figure 9). Benzodiazepines were involved in 11,537 deaths in 2017. These were driven by the combination of these prescription drugs with any opioid. Deaths involving antidepressants are also rising, although at a much slower rate than benzodiazepines. As is the case with benzodiazepines, deaths involving antidepressants are mainly driven by those also involving synthetic opioids.