Download

1 / 20
200 likes | 306 Views
The Characteristic Curves. Putting the solid and fluid together. Williams, 2009 http://www.its.uidaho.edu/BAE558 Modified after Selker, 2000 http://bioe.orst.edu/vzp/. Same principle, now with porous medium.

E N D
The Characteristic Curves • Putting the solid and fluid together Williams, 2009 http://www.its.uidaho.edu/BAE558 Modified after Selker, 2000 http://bioe.orst.edu/vzp/
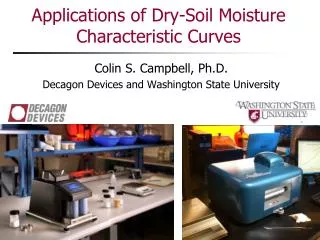
Same principle, now with porous medium • (1) Find a Buchner funnel with pores much smaller than the pores in the soil sample. • (2) Attach a long water-filled tube which connects the funnel to a graduated cylinder half full of water. • (3) Place a thin slice of dry soil on the top of the porous plate. • (4) Keeps track of the amount of water which enters and exits the soil sample as you raise and lower the tube. Buchner Funnel
Back to Buchner funnel experiment... • We will continue through three stages: (1) First (“main”) wetting, (2) First (“main”) drying, and (3) re-wetting (“primary wetting”).
The first step: get the soil wet • (1) MAIN WETTING. Incrementally elevate beaker until water level is at soil height. Measure the water drawn up by the soil as H goes from Pentry to 0. Each measurement is taken allowing the system to come to a steady state. Measuring elevation, H, as positive upward, the pressure applied to the water in this soil will be given by: • Psoil = wgH [2.54]
Now dry it, then re-wet... (2) MAIN DRAINING. Lower the end of the tube, and apply a suction to the water in the soil while measuring outflow. (3) PRIMARY WETTING. repeat (1). This experiment illustrates most of the physics which control the retention and movement of fluids through porous media (2) (3)
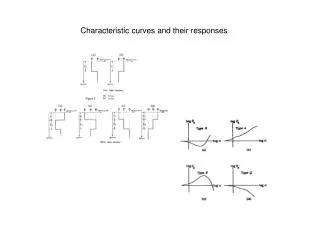
Simplified System • Illustration of “Haines jumps” • Filling • no water enters until the head becomes greater than -2/r1 • When this pressure is exceeded, the pores will suddenly fill • In the draining process • first the outer pores will drain • When the head becomes less than -2/r2 all but isolated pores drain as air can finally enter the necks
So lets go through this step by step • Main wetting curve labeled (1) (2) (3) • More water is taken up by the soil as the beaker comes closer to the elevation of the soil (i.e., as the negative pressure of the feed water decreases) Pressure Water Content
Following the draining process • Main draining curve labeled (3) (4) (5) • Why doesn’t this follow the wetting curve? • Haines jumps and other sources of hysteresis • Degree of saturation is a function of pressure and the history of wetting of the pore • For this reason, the wetting and drying curves for soil are referred to as hysteretic. More on this as we proceed... Pressure Water Content
Particle size to Characteristic Curves • (a) Particles distributed between dmin and dmax • (b) Pore size distribution similar: • The ordinate goes from mass of particles, to volume of pores. • (c) Laplace’s eq. relate pore size filling pressure of each pore. • Plot becomes filling pressure vs. volume of pores. • (d) Finally note volume of pores = degree of saturation. • Question: what’s wrong with bottom 2 figures?
Identifying break points • hw is as the pressure at which the largest group of pore bodies fill. rmax = 2/hw • ha is diameter of the typical pore throats rthroat = 2/ha • r: Why doesn’t the soil drain completely? • Chemically bound water • Fluid held in the very small radius regions at particle contacts. • su: Some pores don't fill due to gas trapping (10%) Pressure Water Content
A word about porous media... • Must be careful not to exceed the air entry pressure (Pa) of the porous plate: If we kept lowering the beaker to exert greater and greater suction, could pull air into plate, instead of pulling water from the soil sample. Porous plate has its own characteristic curve!!
A bit of Terminology • Pendular: volumes of liquid which are hydraulically isolated from nearby fluid • Funicular: liquid which is in hydraulic connection with the bulk fluid.
A few more scanning curves • So we have gone to and from the extremes. • Note that we can also reverse the process in the middle as shown at (6) (7) and (8) • These are examples of primary, secondary, and tertiary scanning curves Pressure Water Content
Hysteresis • Sources • Haines Jumps • Contact Angle • How to deal with it • Independent Domain Models • General Model • Similarity Models
Contact Angle: Young’s Equation • What should the angle of contact between the solid and fluid be, and why? • At equilibrium, forces balance at the point of contact. • Considering horizontal components • Along the horizontal plane (right negative, left positive) • F = 0 = Fsl - Fsg + Flg cos [2.55]
Young’s Eq. continued • F = 0 = Fsl - Fsg + Flg cos [2.55] • Fsg = solid-gas surface force/length; • Fsl = solid-liquid force /length; • Flg = liquid-gas surface force /length. Per unit length, Fik = sik, so may put in terms of the relative surface tensions • sg = sl + lg cos [2.56]
Interpretation of Youngs • Solving [2.56] for the contact angle we find • Physical limits on possible values of : • The contact angle is bounded by 0o < < 180o. So if the operand of cos-1 is greater than 1, then will be 0o, while if the value is less than -1, the value will be 180o. • Often true that (sg - sl) > lg for water, the contact angle for water going into geologic material is often taken to be 0o.
Hysteresis: In the Contact Angle • Contact angle differs for advancing and receding cases. • “Rain-drop effect”: Why a drop of water on a flat plate will not start to move as soon as you tilt the plate: more energy is required to remove the water from the trailing edge of the plate than is given up by the sum of the gravitational potential plus the energy released wetting the plate. • The relevance of the rain-drop effect to capillary hysteresis is simply an extension of the observation regarding the plate and drop: a media will retain water more vigorously than it will absorb water.
Contact Angle Hysteresis: the Rain Drop Effect • What is the physical basis? • At the microscopic level the Young's-Laplace equation is adhered to, • from a macroscopic point of view, the drip cannot advance until the apparent contact angle is quite large. • Upon retreat the macroscopic contact angle will be much smaller than the true microscopic magnitude • Same result from surface contamination.