Download
1 / 22
220 likes | 384 Views
VLF chorus emissions observed by CLUSTER satellites inside the generation region: comparison with the backward wave oscillator model.

E N D
VLF chorus emissions observedby CLUSTER satellites inside the generation region: comparison with the backward wave oscillator model E. E. Titova, B. V. Kozelov Polar Geophysical Institute, Apatity, RussiaV.Y.Trakhtengerts, A. G. DemekhovInstitute of Applied Physics, Nizhny Novgorod, RussiaO. Santolik, E. Macusova Charles University, Prague, Czech Republic and IAP/CAS, Prague, Czech RepublicD. A. Gurnett, J. S. Pickett University of Iowa, Iowa City, IA, USA
Magnetospheric backward wave oscillator (BWO) modelof VLF chorus generation: predictions and comparison with data • Content • Magnetospheric BWO: property of the source region of magnetospheric chorus • Field aligned scale of the source region • Variations of chorus source location • Influence of length of the BWO on chorus characteristics • Magnetospheric BWO: parameters of chorus elements • Growth rate for BWO regime • • Frequency drift • • Saturation amplitude • Conclusions V. Y. Trakhtengerts, 1995, 1999
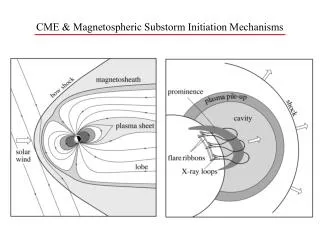
Field aligned scale of chorus source region According to Trakhtengerts (1995), the interaction length l of whistler waves and energetic electrons can be written for the dipole magnetic field as follows: lBWO = (R02L2/k)1/3 where R0 is the Earth's radius, L is the geomagnetic shell, and k is the whistler wave number. The backwardwave oscillator (BWO) regime of the whistler cyclotron instability takes place in a narrow near equatorial region: lBWO~ 103 km LeDocq et al., 1998; Parrot et al., 2003; Santolik et al. 2003, 2005
Size and central position of the source region from multipoint measurement of the Poynting flux by the Cluster satellitesSantolik et al. 2003, 2005 Poynting flux measurements show • the size of the source region is a few thousands of km along the filed line • strong variations of the central position of the chorus source region
Dynamical magnetic field model Deviation of the observed magnetic field from value modeled by Tsyganenko-96 model: For two currents and two positions of CLUSTER satellites: p1,2 are known positions of two CLUSTER satellites, I1 and I2 are two line currents, i1 and i2 are unit vectors of their directions, r1 and r2 are points at the line currents The main characteristics of the magnetospheric BWO:effective length along the magnetic filed line (LBWO) position at the magnetic filed line (position of Bmin) Kozelov, Demekhov, Titova, Trakhtengerts et al., 2008
Estimation of effective BWO length Introduce the relative magnetic-field perturbation b(z): The cyclotron resonance frequency mismatch is The cyclotron resonance phase mismatch is obtained using the known magnetic-field profile as The experimentally derived BWO length LBWO is then obtained as finding the distance between such points z1 and z2 that
Results of modeling of the magnetospheric BWO configurations on 31 March 2001 for a magnetic field line at the CLUSTER-1 position. • thin line (not seen) is the observed strength of the magnetic field, dashed line - calculated by Tsy-96, solid line - fitted by a model with 2 additional currents. • the modeled magnetic field along the magnetic field line. • symbols mark the calculated positions of the magnetic field minimum, solid and dashed lines show, respectively, the smoothed evolution of this position and the CLUSTER orbit. • evolution of the estimated length of the magnetospheric BWO. Kozelov, Demekhov, Titova, Trakhtengerts et al., 2008
Comparison of the minimum B location obtained from local magnetic field modeling with the center of the chorus source obtained from the VLF STAFF data • Solid line and symbols – position of the BWO center (minimum-B point) estimated from the dynamical model of the local magnetic field; red dashed line – position of the VLF source from [Santolik et al., 2005]; long dashed lines – satellite trajectories. • Parallel component of the Poynting vector normalized by its standard deviation for CLUSTER-1 [Santolik et al., 2005]. The obtained variation of the position of minimum B along the field line qualitatively agrees well with the variation of the chorus source location previously obtained from the STAFF data [Santolik et al., 2005]. Kozelov, Demekhov, Titova, Trakhtengerts et al., 2008
Results of simulations of nonlinear equations for the magnetospheric BWO [Demekhov and Trakhtengerts, 2005] with two magnetic field profiles corresponding to different time intervals of April 18, 2002. the geomagnetic field dependences total Poynting flux in arbitrary units as a function of time and z-coordinate. The center of the source region corresponds to Stot = 0. The plots demonstrate that the center of the chorus source region in the simulations remains near the local minimum of the geomagnetic field.
The estimated threshold flux (cm-2s-1sr-1) for the BWO generation in “on-off” intermittency regime. The threshold electron flux Sthr for the BWO generation (Trakhtengerts et al., 2004) vres is the parallel velocity of the resonant electrons, for this event Ne= 5 cm-3 we assume for estimates that hstep≈ 0.1 and v┴ ≈ vres,
Estimation of growth rate of the BWO regime of VLF chorus generation using frequency sweep rate of chorus elements • According of BWO model of chorus generation (Trakhtengerts, 1999) • the frequency sweep rate df/dt at the exit from BWO generation region can be written as • df/dt = ( γ2BWO + S1) 1.5 ω /(ωH + 2ω) • where γ2BWOthe growth rate of the absolute (BWO) instability, • S1 = 0.3 V|| (d ωH/dz) • characterizes the magnetic field inhomogeneity effect. • We introduce the "reduced" frequency sweep rate G, which is equal the growth rate of the BWO regime for γ2BWO >> S1. • G 2df/dt (ωH + 2 ω)/ 1.5 ω = γ2BWO
The frequency sweep rate of VLF chorus emissions as inferred from Magion 5 satellite Titova et al., 2003 The mean of the "reduced" frequency sweep rate G(L) varies within a small interval 100–300 s–1, that is in a good agreement with estimates of γ2BWO from the BWO theory obtained from chorus elements on MAGION 5 satellite as a function of L shell. The chorus growth rate, estimated from the frequency sweep rate, is in accord with that inferred from the BWO generation mechanism
The growth rate of the absolute (BWO) instability, the frequency sweep rates and the chorus amplitudes • Thegrowth rate of the absolute (BWO) instability γ2BWO • γBWO / Ωtr ≈ 32/ (3π) • where the trapping frequency Ώtris determined by the expression • Ωtr = (k u ωH b)1/2 • Hereb = B~ /B L ,B~is the whistler wave magnetic field amplitude, BLis thegeomagnetic field, and uis the electron velocity component across the geomagnetic field. • G2 = df/dt (ωH + 2ω)/ 1.5ω = γ2BWO ~ b • the BWO model predicts an increase in frequency sweep rate df/dt and G2 with chorus amplitude • B~ = (10 m c / e k u)*γ2BWO
The frequency sweep rate of VLF chorus emissions on CLUSTER satellite The reduced sweep rate G2 as a function of chorus amplitude for event CLUSTER 1, 31.03.2001 The reduced sweep rate G2 as a function of chorus amplitude for event CLUSTER 1, 18.04.2002 The frequency sweep rate increases with chorus amplitude, in accordance with the BWO model.
Summary of chorus parameters inthe BWO model for Cluster data 18.04.2002 Basic parameters : L = 4. 4, cold plasma density Nc~ 2 cm -2 , ω/ωH ≈ 0.45 , Wres = me/2 (ωH – ω)2/k2 = 62 keV, the wavelength 26 km. The flux density of energetic electrons is assumed to be S ~ 4*108 cm2 s-1
We study the sweep rate of the emission frequency as a function of the cold plasma density in the equatorial plane and than we compare it with the prediction of BWO model. • We investigate wave packets from detailed time-frequency spectrograms measured by the WBD instrument on board the Cluster spacecraft. • The local electron densities during 15 processed time intervals were obtained from the WHISPER instrument.
December 22, 2001 [t1 , f1][t2 , f2]f1 ‹ f2 (sweep rate) An example of chorus elements measured on board the Cluster satellites on December 22, 2001 by the wideband (WBD) plasma wave instrument. Spacecraft position is given on the bottom: UT-universal time; λm-magnetic dipole latitude; RE - Earth radius; MLT-magnetic local time.
06.12.2003 (14:30 - 15:00 UT) 22.01.2002 (17:40-17:50 UT) 08.02.2005(11:51-12:13 UT) The Kp index was 30 and the electron density was about 10 cm−3 The electron density was about 11 cm−3 and the Kp index was 2-. 08.02.2001(ne-=9 cm-3) df/dt:10.61 kHz/s (N=236)and -9.64 kHz/s (N=156) 22.12.2001(ne-=10 cm-3) df/dt: no risers and -11.02 kHz/s (N=1036) 06.12.2003(ne-=10 cm-3)df/dt: 9.36 kHz/s (N=5568)and no fallers
25.03.2002 (13:56 - 14:20 UT) 21.10. 2001 (23:15 - 23:35 UT) 08.02.2005(11:51-12:13 UT) The electron densitywas about 192 cm−3 and Kp index was 8− The Kp index was 20 and the electron density was about 39 cm−3 12.4.2001 (ne-= 27 cm-3)df/dt: 5.97 kHz/s (N=351) and no fallers 25.03.2002 (ne-= 39 cm-3) df/dt: 3.91 kHz/s and no fallers 21.10.2001 (ne-= 192cm-3) df/dt: 1.69 kHz/s (N=972)and -3.11 kHz/s
The sweep-rate estimate on base of BWO model of Trakhtengerts et al., 2004 yields the following scaling: df/dt =C * n-2/3 where n is the plasma density and C is a free parameter.
Conclusions Within the framework of the BWO generation model, it is possible to explain the properties of the chorus emissions at frequencies below fH/2, observed by Cluster satellites, such as • field aligned scale of the source region and the direction of the energy flux • this motion of chorus source by deviation of the magnetic field minimum (the local “magnetic equator”) • influence of effective length of the magnetospheric BWO on chorus characteristics • chorus growth rate, estimated from the frequency sweep rate, is in accord with that inferred from the BWO generation mechanism. • correlation between the frequency sweep rates and the chorus amplitudes. • amplitude of chorus • The theoretical scaling based on the BWO theory predict increasing sweep rate of chorus elements for decreasing cold plasmadensityas df/dt =C * n-2/3. The results observations on CLUSTER consistent with these predictions
Some principal questions remain unclear • Relation between chorus and hiss emissions • Formation of a step-like distortion at the electron distribution function • Nonducted propagation • Damping of chorus emission on fH/2