Download
1 / 30
310 likes | 466 Views
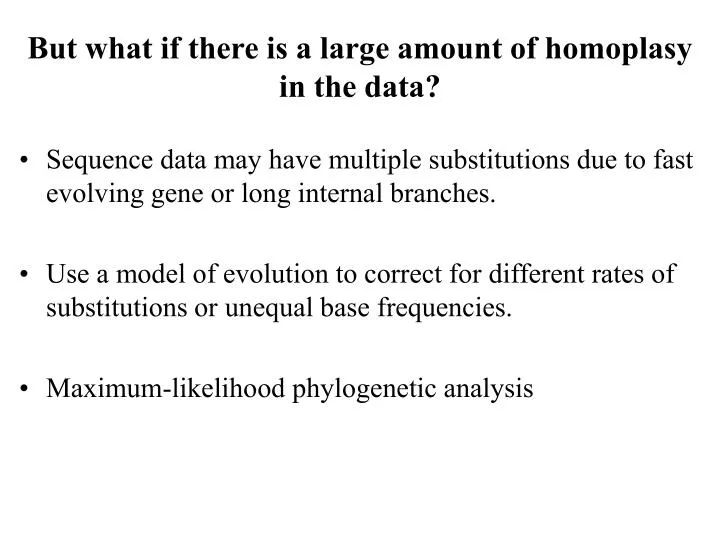
But what if there is a large amount of homoplasy in the data?. Sequence data may have multiple substitutions due to fast evolving gene or long internal branches. Use a model of evolution to correct for different rates of substitutions or unequal base frequencies.

E N D
But what if there is a large amount of homoplasy in the data? • Sequence data may have multiple substitutions due to fast evolving gene or long internal branches. • Use a model of evolution to correct for different rates of substitutions or unequal base frequencies. • Maximum-likelihood phylogenetic analysis
1 3 2 C G T A C A 1 Multiple changes at a single site - hidden changes Seq 1 AGCGAG Seq 2 GCGGAC A C Number of changes A Seq 1 Seq 2
But what if there is a large amount of homoplasy in the data? • Sequence data may have multiple substitutions due to fast evolving gene or long internal branches. • Use a model of evolution to correct for different rates of substitutions or unequal base frequencies. • Maximum-likelihood phylogenetic analysis
Models of sequence evolution • Simplest Model= Jukes-Cantor - Assumes all substitutions are equally likely, corrects for multiple substitutions by using a natural log transformation • A bit more complicated= Kimura 2-parameter, assumes different rates for transitions and transversions, but equal base frequencies • More complicated models: HKY, (General Times Reversible (GTR) • Use a model that best fits your data
Phylogenetic Inference Using Maximum Likelihood • Model of sequence evolution and the estimation of its parameters allows the placement of probabilities on different types of substitutional change • Likelihood analysis focuses on the data, not the tree. It is the probability of the data given a tree and a model of evolution. L=P(DT, M)
Seq 1 ATATC Seq 2 CTAGC The Likelihood (i.e. the probability of observing the data) is a sum over all possible assignments of nucleotides to the internal nodes
Phylogenetic Inference Using Maximum Likelihood • Calculate the Likelihood for each base position in the sequence and summarize across all base positions. • The ML tree is the tree that produces the highest likelihood. • Evaluating the branching structure of the tree, but also the branch length, using similar tree-searching strategies as used in parsimony analysis. • This is important, because by using a model-based approach, mutational change is more probable along longer braches than on shorter branches. • Can be extremely computationally intensive.
Seq 1 ATATC Seq 2 CTAGC The Likelihood (i.e. the probability of observing the data) is a sum over all possible assignments of nucleotides to the internal nodes
The larger the data set (both in numbers of species and characters) the longer the analysis.
Phylogenetic Inference Using Maximum Likelihood • Important point about ML: The model you choose to use can have a large impact on the resulting ML tree. • If you flip a coin and get a head, what is its likelihood? • If it’s a 2 sided and fair coin (your model), the likelihood is 0.5 • If it’s a two-headed coin (your model), the likelihood is 1.0
Phylogenetic Inference Using Distance Data • Possible alternative to computationally intensive parsimony and ML searches. • Distances attempt to summarize the differences between two sequences in a single measurement. • Can use an uncorrected distance between taxa, based on some the observed number of nucleotide differences between the pairs of taxa. • Alternatively, you can use a distance based on an evolutionary model to account for multiple substitutions between taxa.
Phylogenetic Inference Using Distance Data The simplest form of phylogeny construction using distance data is UPGMA: Unweighted Pair Group Method with Arithmetic Mean A B C D E B 2 C 4 4 D 6 6 6 E 6 6 6 4 F 8 8 8 8 8 A,B C D E C 4 D 6 6 E 6 6 4 F 8 8 8 8
Phylogenetic Inference Using Distance Data • UPGMA is fast, but makes assumption of molecular clock, that all taxa have roughly equal substitution rates • Other distance-based methods (quite a few, in fact) that can be used that do not make this assumption: Most commonly used is Neighbor-Joining. • In general, distance based methods perform OK, but not as good as methods using Likelihood
Assessing The Robustness Of Our Trees • We’ve seen a number of ways to construct phylogenetic trees, but how much confidence do we place on the reconstructed relationships? • We can use a number of methods to assess the robustness of particular branches in our trees • Bootstrapping, Jacknifing, Decay-Index
Bootstrapping and Jackknifing • Multiple new data sets are made by resampling from the original data set. • Bootstrapping: Sampling done with replacement • Jackknifing: Sampling done without replacement • The resampled data sets are subjected to phylogenetic analysis. • The proportion of times a clade appears in the trees across all replicate data sets is called its bootstrap proportion.
Taken from Baldauf, S. L. Phylogeny for the faint of heart: a tutorial. Trends in Genetics 19:345-351.
Bootstrapping and Jackknifing • Clades that receive a high bootstrap are considered to be more supported by the data than clades with a lower bootstrap. • 70% or greater is good, but many phylogeneticists will only consider branches with ≥90% as being strongly supported. • Jackknifing is seldom done anymore, but adheres to the same general patterns for support. Bootstrap
Bootstrapping and Jackknifing • Can perform with any type of phylogenetic analysis: parsimony, ML, distance-based • Important to emphasize that a bootstrap does not reveal the probability that a particular clade is true, but only how well it is supported by the particular dataset.
Decay analysis • Assesses whether a clade is found in a less parsimonious tree. • The difference in tree length between the overall most parsimonious tree and the most parsimonious tree that does not contain the clade of interest. 1 2 3 4 1 2 3 4 1 2 3 4 * * Tree Length=20 Tree Length=21 Tree Length=22 Decay Index for * is 22-20=2
Decay Indices: Interpretation • Generally, the higher the decay index the better the relative support for a group • Unlike BPs decay indices are not scaled (0-100) and it is less clear what is an acceptable decay index • In general, the magnitude of decay indices and BPs generally correlated (i.e. they tend to agree) Decay Index
Phylogenetic Evaluation of Homology and Character Evolution Some salamander families are external fertilizers, some have internal fertilization. Internal fertilization has long been thought to have arisen only once in the phylogeny of salamanders. Phylogenetic analysis of morphological supports this hypothesis Internal Fertilization
Phylogenetic Evaluation of Homology and Character Evolution Phylogenetic analysis of nuclear rRNA data provides an alternative tree, suggesting that internally fertilizing salamanders are not a monophyletic group. Parsimony analysis weakly supports this hypothesis.
Maximum-Likelihood Analysis of Molecular Data Strongly Support Non-monophyly of Internal Fertilization ML rRNA ML mtDNA I I I I I I E E E E I I E I E I I I I I
Phylogenetic Evaluation of Homology and Character Evolution • Molecular Data sets can produce trees that are different from morphological data. • Independent molecular data setsindicate that internally fertilizing salamanders do not form a monophyletic group. • Multiple reversals from internal to external fertilization. • Phylogenetic analysis of new data sets can give new perspectives on the evolution of characters that were not previously available.
Molecular Clocks • Mutation rate in genes is relatively constant across species. • Based on assumptions of the neutral theory-the majority of mutations that occur are selectively neutral. Should accumulate at a rate equal to the mutation rate. • To functionally apply a molecular clock, you assume that mutations rates will not vary across species. • This typically limits the application of a molecular clock to a set of closely related species.
Molecular Clocks 1) Construct A Tree 2) Date a Node in the Tree Outgroup Outgroup Species 1 Species 1 Species 2 Species 2 Species 3 Species 3 Species 4 Species 4 You know that the most recent possible divergence between 3 and 4 is at least 1 MY Fossil for Species 4 ~1 MY 3) Calculate Divergence 4) Calculate a Rate Species 3 } 2% Sequence Divergence R= 2%/1MY Species 4
Molecular Clocks 5) Apply Rate to Other Nodes in Tree Outgroup Species 1 Species 2 Species 3 5MY Species 4 2MY 1MY • Best applied when dates available for multiple nodes. • Can utilize solid geological information as well as fossil information. • Must be aware of possible non-clock behavior of genes.
Phylogeny of North American Black Basses Near et al., 2003. Evolution 57:1610–1621. Previous hypothesis that speciation within the genus Micropterus occurred during the Pleistocene. Micropterus has a very good fossil record. Calibration of a molecular clock and calculation of divergence times among species reveals that most species diverged well before the Pleistocene
Phylogenetics and Historical Biogeography Uses phylogenetic trees to try and information from geography, geology and environment to try and understand how organisms have gotten to where they are today. Example from European and Turkish salamanders
} ~20MY Genetic divergence correlates with the geological divergence between Europe and Turkey during the Miocene x x x x