Download
1 / 10
100 likes | 210 Views
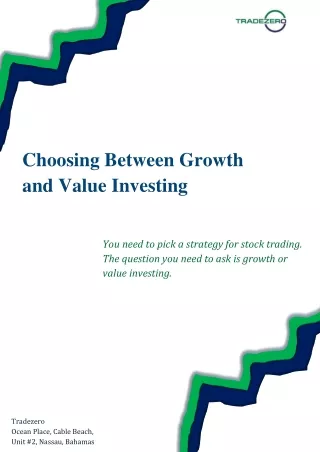
Learn about growth and value investing in securities offered through Lincoln Financial Advisors Corp. Discover the key differences and benefits of growth and value stocks, as well as historical data on returns. Make informed investment decisions with Lincoln Financial!

E N D
Growth and Value Investing Securities offered through Lincoln Financial Advisors Corp., a broker/dealer,1300 S. Clinton Street, Fort Wayne, IN 46802-3506, Phone 800-454-6265.Insurance offered through Lincoln affiliates and other fine companies.Lincoln Financial Group is the marketing name for Lincoln National Corporation and its affiliates. CRN200510-1003366
Growth stocks High growth rate of earnings, sales Low book-to-price, high price-to-earnings ratios Paying lower or no dividends Risks Future growth does not occur as expected Book-to-price ratios rise unexpectedly, price-to-earnings ratios decline unexpectedly Value stocks Slower growth of earnings and sales High book-to-price, low price-to-earnings ratios Higher dividend yields Turnaround opportunities Risks Evaluation of stock as good value is misread Difficult to stick to value policy when prices are beaten down What are growth and value stocks?
Small value $43,605 14.9% Small growth $1,165 9.6% Growth and value investing Year-end 1927–2004 Endingwealth Average return $100,000 Large value $10,000 $5,642 11.9% Large growth $1,000 $859 9.2% $100 $10 $1 $.10 1927 1937 1947 1957 1967 1977 1987 1997 2004 Hypothetical value of $1 invested at year-end 1927. Assumes reinvestment of income and no transaction costs or taxes.
Small value Large value Large growth $4.68 16.7% $3.19 12.3% $2.77 10.7% Growth and value investing Year-end 1994–2004 Ending wealth Average return $6 $5 Small growth $4 $3 $2.39 9.1% $2 $1 $.9 1994 1995 1996 1997 1998 1999 2000 2001 2002 2003 2004 Hypothetical value of $1 invested at year-end 1994. Assumes reinvestment of income and no transaction costs or taxes.
Risk versus return Growth and value stocks 1969–2004 17% Small value 15% Mid value 13% Large value 11% Mid growth Compound annual return Large growth 9% Small growth 7% 5% 3% 15% 17% 19% 21% 23% 25% 27% 29% Standard deviation
Growth and value by decade Compound annual rates of return by decade 25% Growth stocks 20% Value stocks 15% 10% 5% 0% -5% -10% -15% 1920s* 1930s 1940s 1950s 1960s 1970s 1980s 1990s 2000s** *Based on the years 1928–1929. **Based on the years 2000–2004.
Large value Growth versus value stocks One-year growth and value trends 1969–2004 40% Large growth 30% Annual premiums 20% 10% 0% 1969 1974 1979 1984 1989 1994 1999 2004 Data calculated using rolling 12-month returns.
Large value Growth versus value stocks Three-year growth and value trends 1969–2004 25% Large growth 20% 15% Annual premiums 10% 5% 0% 1971 1976 1981 1986 1991 1996 2001 2004 Data calculated using rolling 36-month returns.
Growth and value excess returns 12-month excess returns relative to the S&P 500 1969–2004 30% Large value Large growth 20% 10% Excess returns 0% -10% -20% -30% 1969 1974 1979 1984 1989 1994 1999 2004
Diversified portfolio $1,315 Growth and value diversification benefits Year-end 1997–2004 $2,200 Large value Large growth $1,900 $1,600 $1,387 $1,300 $1,213 $1,000 $700 1997 1998 1999 2000 2001 2002 2003 2004 Diversified portfolio represented by 50% growth stocks and 50% value stocks.