Sergey Kravchenko
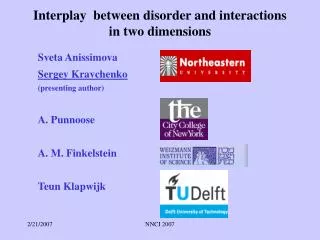
Approaching an (unknown) phase transition in two dimensions. Sergey Kravchenko. in collaboration with:. A. Mokashi (Northeastern) S. Li (City College of New York) A. A. Shashkin (ISSP Chernogolovka) V . T. Dolgopolov (ISSP Chernogolovka) T . M. Klapwijk (TU Delft)

Sergey Kravchenko
E N D
Presentation Transcript
Approaching an (unknown) phase transition in two dimensions Sergey Kravchenko in collaboration with: A. Mokashi (Northeastern) S. Li (City College of New York) A. A. Shashkin (ISSP Chernogolovka) V. T. Dolgopolov (ISSP Chernogolovka) T. M. Klapwijk (TU Delft) M. P. Sarachik (City College of New York
Non-interacting electron gas in two dimensions (boring): • Low disorder: weak (logarithmic) insulator • High disorder: strong (exponential) insulator
Coulomb energy Fermi energy rs = Wigner crystal Strongly correlated liquid Gas strength of interactions increases ~35 ~1 rs Terra incognita
Suggested phase diagrams for strongly interacting electrons in two dimensions strong insulator strong insulator disorder disorder electron density electron density Attaccalite et al. Phys. Rev. Lett. 88, 256601 (2002) Tanatar and Ceperley, Phys. Rev. B 39, 5005 (1989) strongly disordered sample Wigner crystal Ferromagnetic Fermi liquid Paramagnetic Fermi liquid, weak insulator Wigner crystal Paramagnetic Fermi liquid, weak insulator clean sample strength of interactions increases strength of interactions increases
In 2D, the kinetic (Fermi) energy is proportional to the electron density: EF = (h2/m) Ns while the potential (Coulomb) energy is proportional to Ns1/2: EC = (e2/ε) Ns1/2 Therefore, the relative strength of interactions increases as the density decreases: University of Virginia
WhySi MOSFETs? It turns out to be a very convenient 2D system to study strongly-interacting regime because of: • large effective mass m*=0.19 m0 • twovalleys in the electronic spectrum • low average dielectric constant =7.7 As a result, at low densities, Coulomb energy strongly exceeds Fermi energy: EC >> EF rs = EC / EF >10 can be easily reached in clean samples. For comparison, in n-GaAs/AlGaAs heterostructures, this would require 100 times lower electron densities. Such samples are not yet available.
Al SiO2 p-Si conductance band 2D electrons chemical potential energy valence band _ + distance into the sample (perpendicular to the surface) 10/10/09 University of Virginia
Metal-insulator transition in 2D semiconductors Kravchenko, Mason, Bowker, Furneaux, Pudalov, and D’Iorio, PRB 1995
In very clean samples, the transition is practically universal: Sarachik and Kravchenko, PNAS 1999; Kravchenko and Klapwijk, PRL 2000 (Note: samples from different sources, measured in different labs)
Similar transition has later been observed in other 2D structures: • p-Si:Ge (Coleridge’s group; Ensslin’s group) • p-GaAs/AlGaAs (Tsui’s group, Boebinger’s group) • n-GaAs/AlGaAs (Tsui’s group, Stormer’s group, Eisenstein’s group) • n-Si:Ge (Okamoto’s group, Tsui’s group) • p-AlAs (Shayegan’s group) (Hanein, Shahar, Tsui et al., PRL 1998)
Magnetic field, by aligning spins, changes metallic R(T) to insulating: Such a dramatic reaction on parallel magnetic field suggests unusual spin properties! (spins aligned)
Magnetoresistancein a parallel magnetic field T = 30 mK Bc Bc Shashkin, Kravchenko, Dolgopolov, and Klapwijk, PRL 2001 Bc Spins become fully polarized (Okamoto et al., PRL 1999; Vitkalov et al., PRL 2000)
Extrapolated polarization field, Bc, vanishes at a finite electron density, n Shashkin, Kravchenko, Dolgopolov, and Klapwijk, PRL 2001 n Spontaneous spin polarization at n?
gm as a function of electron densitycalculated using g*m* = ћ2ns / BcB (Shashkin et al., PRL 2001) n
Magnetic measurements without magnetometer suggested by B. I. Halperin (1998); first implemented by O. Prus, M. Reznikov, U. Sivan et al. (2002) 1010 Ohm - + Gate Current amplifier Vg SiO2 Modulated magnetic field B + B Si 2D electron gas Ohmic contact i ~ d/dB = - dM/dns
Magnetization of non-interacting electrons spin-up spin-down gBB dM M dns B ns ns
Magnetic field of the full spin polarization vs. ns spontaneous spin polarization at n non-interacting system Bns B/Bc forB < Bc Bc = h2ns/B g*m* Bc = h2ns/2Bmb M = Bns = Bns forB > Bc dM Bc dns B > Bc 0 B ns n B < Bc 0 ns
Raw magnetization data: induced current vs. gate voltage d/dB = - dM/dn 1 fA!! B|| = 5 tesla
Raw magnetization data: induced current vs. gate voltage Integral of the previous slide gives M (ns): complete spin polarization at ns=1.5x1011 cm-2 B|| = 5 tesla Bar-Ilan University
Spin susceptibility exhibits critical behavior near the sample-independent critical density n : ~ ns/(ns – n) insulator T-dependent regime
Effective mass vs. g-factor (from the analysis of the transport data in spirit of Zala, Narozhny, and Aleiner, PRB 2001) : Shashkin, Kravchenko, Dolgopolov, and Klapwijk, PRB (2002)
Another way to measure m*: amplitude of the weak-field Shubnikov-de Haas oscillations vs. temperature high density low density (Rahimi, Anissimova, Sakr, Kravchenko, and Klapwijk, PRL 2003)
Comparison of the effective masses determined by two independent experimental methods: 15 11 8 rs (Shashkin, Rahimi, Anissimova, Kravchenko, Dolgopolov, and Klapwijk, PRL 2003)
Thermopower: S = - V / (T) S = Sd + Sg = T + Ts V : heat either end of the sample, measure the induced voltage difference in the shaded region T : use two thermometers to determine the temperature gradient
Critical behavior of thermopower (-T/S) (ns- nt)x ∝ x=1.0+/-0.1 nt=7.8+/-0.1*1010cm-2 and is independent of the level of the disorder
Divergence of the effective electron mass In the low-temperature metallic regime, the diffusion thermopower of strongly interacting 2D electrons is given by the relation T/S ∝ ns /m Therefore, divergence of the thermopower indicates a divergence of the effective mass: m ∝ ns /(ns − nt) Dolgopolov and Gold, JETP Lett. 2011 We observe the increase of the effective mass up to m 25mb5me!!
A divergence of the effective mass has been predicted… • using Gutzwiller's theory (Dolgopolov, JETP Lett. 2002) • using an analogy with He3 near the onset of Wigner crystallization (Spivak, PRB 2003; Spivak and Kivelson, PRB 2004) • extending the Fermi liquid concept to the strongly-interacting limit (Khodelet al., PRB 2008) • solving an extended Hubbard model using dynamical mean-field theory (Pankov and Dobrosavljevic, PRB 2008) • from a renormalization group analysis for multi-valley 2D systems (Punnoose and Finkelstein, Science 2005) • by Monte-Carlo simulations (Marchiet al., PRB 2009; Fleury and Waintal, PRB 2010)
Transport properties of the insulating phase If the insulating state were due to a single-partical localization, a several orders of magnitude higher electric field would be needed to delocalize an electron: eEcl > Wb ~ 0.1 – 1 meV But if this is a pinned Wigner solid, the electric field “pulls” many electrons while only one is pinned – hence, much weaker electric fields are required to depin it and break localization.
SUMMARY: • In the clean regime, spin susceptibility critically grows upon approaching to some sample-independent critical point, n, pointing to the existence of a phase transition. Unfortunately, residual disorder does not allow to see this transition in currently available samples • The dramatic increase of the spin susceptibility is due to the divergence of the effective mass rather than that of the g-factor and, therefore, is not related to the Stoner instability. It may be a precursor phase or a direct transition to the long sought-after Wigner solid. However, the existing data, although consistent with the formation of the Wigner solid, are not enough to reliably confirm its existence.