Download
1 / 43
430 likes | 532 Views
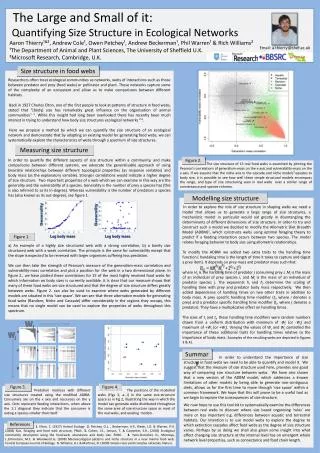
Explore the impact of societal risk averseness on safety in transport networks, from Kobe 1995 to Christchurch 2011. Learn about the subjective nature of risk, topology vulnerabilities, loss quantification, and ongoing research in degradable transport networks.

E N D
Degradable Transport Networks: Quantifying the Unquantifiable Professor Michael G H Bell ITLS, University of Sydney Business School
Scope of presentation • From Kobe 1995 to Christchurch 2011 • Subjectivity of risk • Societal risk averseness determines safety • Transport network topology and vulnerability • Minmax loss and demon games • Hyperpaths • On-going research and development • Conclusions
Christchurch 2011*: Many older buildings crumbled *Thanks to Professor Alan Nicholson for a guided tour of Christchurch last week
Risk is subjective • Risk is likelihood of accident per unit time multiplied by the size of consequence • Future is uncertain so risk estimated not observable • Estimating risk involves judgement in • Defining scenarios, failure modes, etc • Devising experiments to determine failure rates • Consequently estimating risk is subjective
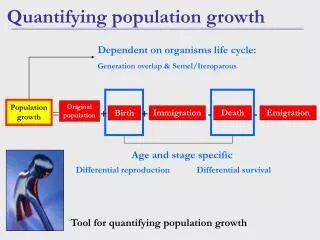
Empiricism (Evans, 2004) • Events (accidents) occur randomly at rate μ • Fatalities per accident also occur randomly with mean λ • Mean fatality rate is therefore μλ • Project forward mean fatality rate multiplied by the effect of the Train Protection and Warning System, … • Judgement still required so subjectivity remains
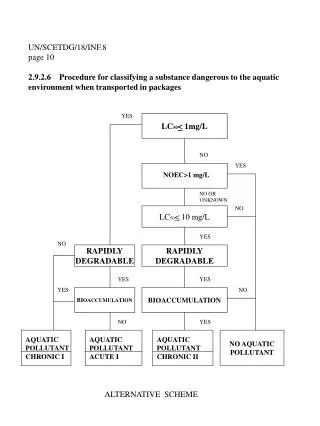
Boundary Consequence HE HE HE Causes Hazardous Events • Events with potential for death or injury • High frequency low consequence events • Routine, plentiful recorded data • Low frequency high consequence events • Rare, little recorded data
Boundary Consequence HE HE HE Causes Risk analysis • Scope definition: Set boundaries • Hazard identification: List hazardous events • Hazard analysis: • Research the causes of hazardous events • Estimate the consequences of hazardous events • Risk appraisal: Judge the tolerability of risks
Passenger train derailment Hazardous event OR Track fault Obstruction Over- speeding Rolling stock fault OR Broken rail Buckled rail Twisted rail B o u n d a r y o f t h e s y s t e m Fault tree
Hazardous event Train derails Does train maintain clearance? Yes No Does train obstruct adjacent line? No Yes Is there a collision with train on adjacent line? No Yes B o u n d a r y o f t h e s y s t e m Event tree
Problems with fault trees • Common causes leading to correlations in event likelihoods • Bias in fault tree construction due to information availability • Important causes over-looked • Assumptions of randomness
Subjectivity of risk analysis • Likelihood: • Is human error or a software crash random? • Have all failure modes been identified? • Is there sufficient historic data and, if so, have conditions remained constant? • Consequence: • Which is the “final” event in a chain? (Loss of life?) • Have all losses been identified? (Clean up costs?) • What is the worst credible case?
Plane accidents Weight or Disutility Train accidents Car accidents Size of accident Societal risk averseness affects safety
Road network for Switzerland Source: IVT at ETH, Zurich Generated by VISUM of PTV
Different network topologies Random network: Democratic distribution of connections (transport infrastructure) Scale-free network: Preferential attachment of new connections (transport tasks)
Random network: Transport infrastructure Typicalnode
Power Law Distribution of Node Linkages Scale-free network: Transport tasks
Topology, reliability and vulnerability • Scale-free networks tend to be • robust to random failure but • susceptible to attack • Random networks tend to be • susceptible to random failure but • robust to attack
Random network with random node failure Failed node Node Before After
Scale-free network with random node failure Failed node Hub Before After
Scale-free network under directed node attack Attacked hub Hub Before After
Societal risk aversion and demon games • Societal risk aversion shifts the focus from the likelihood of a hazardous event to its potential consequences • The planner, dispatcher, traveller is attracted to the option that minimises the maximum loss • This is equivalent to a demon game • As with empiricism, judgement still involved in defining scenarios, failure modes, etc.
Game of chess: Accidents caused by complexity • You plan to win • Your opponent observes your moves and plans to prevent you winning • An accident is a failure to foresee your opponent’s strategy • Too many possible strategies, so accidents inevitable
Town X Route B Route A City Y Routing strategies in an uncertain network
Town X Route B Route A City Y Demon game
Hyperpaths • Hyperpaths are sets of paths that are attractive (may be useful) • Alternatives are provided • Unattractive paths are not included • Hyperpaths can be generated by demon games • Density of the hyperpath depends on the size of potential losses • Single demon generates a denser hyperpath than node-specific demons ceteris paribus • Demons can be associated with failure scenarios • Great flexibility in defining hyperpaths • Hyperpaths are easy to generate • Node-specific demons may be solved by a version of the Spiess and Florian algorithm • All demon configurations lead to some form of LP
Hyperpath generation • Define scenarios (failure modes) and a cost or penalty for each scenario • Formulate a minmax problem: • Convert the problem to a linear program (LP): • Solve the LP, p defines the hyperpath and q are dual variables
On-going research: INSTR • 1995 Kobe earthquake and Iida initiative • EPSRC-funded research • Workshops on transport network reliability in Hong Kong, Newcastle and Ehime • 1st International Symposium on Transport Network Reliability (INSTR) in Kyoto, 2001 • 2nd INSTR in Christchurch, New Zealand, 2004 • 3rd INSTR in Delft, Holland, 2007 • 4th INSTR in Minneapolis, USA, 2010 • 5th INSTR in Hong Kong, 2012 • 6th INSTR in Nara, Japan, 2015
On-going research: Resilience in nature • Joint work with the Behaviour and Genetics of Behavioural Insects Lab • Ants and slime moulds have evolved supply chains over millions of years • Different kinds of ant and slime mould face different threats • Threats define the topology and use of networks • We are seeking funds to see what we can learn from nature to improve supply chain resilience
Conclusions • Likelihood of a HE is unquantifiable • Consequence of a HE is unquantifiable • Society is risk-averse so minmax consequences is a rational design and operational principle • Minmax consequences objective equivalent to demon games • Demon games lead to linear programs which define hyperpaths • However, when scenarios can be defined (and costed), the best usage of risky alternatives can be quantified! • Future research – learning from nature, specifically ants and slime mould, about how to design and use supply chains and transport networks resiliently.