
Integrated Bushfire Risk Analysis and Simulation for Urban Interface Threats in Hobart
This study develops a comprehensive method for assessing bushfire risks and their potential impact on urban areas, specifically the Hobart region. Utilizing a combination of historical ignition data, fire behavior models, and a sophisticated geographical information system (GIS), the analysis quantifies the probability of ignition and spread, alongside the consequences of bushfires in populated regions. By examining topographical, fuel, and weather factors, this approach allows fire management authorities to make informed decisions on risk mitigation strategies, ensuring enhanced community safety.

Integrated Bushfire Risk Analysis and Simulation for Urban Interface Threats in Hobart
E N D
Presentation Transcript
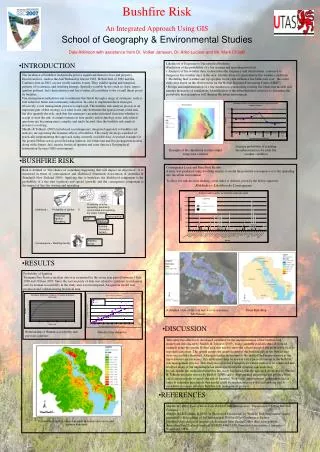
Probability of a fire spreading, becoming uncontrolled and reaching the urban interface Likelihood = Probability of Ignition X Historical Ignition Modelling Topographical Fuel Weather Bushfire Simulation System Address points Consequence = Dwelling density • INTRODUCTION • Likelihood of Exposure to Uncontrolled Bushfire. • Prediction of the probability of a fire starting and spreading involved: • Analysis of fire weather data, to determine the frequency and observations contusive to dangerous fire weather days in the area. Identification of representative fire weather conditions • Modelling fuel, weather and topographic factors that influence fire behaviour over the entire study area based on the observations for the Hobart Regional Forecasting Centre (HRFC) • Design and implementation of a fire simulation system using existing fire behaviour models and running thousands of simulations. Identification of the urban/bushland interface to determine the probability that an ignition will threaten the urban environment. • . The incidence of bushfires in Australia poses a significant threat to lives and property. Disastrous fires, such as the Ash Wednesday fires in 1983, Hobart fires of 1967 and the Canberra fires in 2003, are not totally random events. They exhibit spatial and temporal patterns of occurrence and resulting damage. Spatially variable factors such as slope, aspect, ignition patterns, fuel characteristics and fire weather all contribute to the overall threat posed by bushfire. Fire management authorities aim to minimise this threat through a range of strategies, such as fuel reduction burns and community education. In order to implement these strategies effectively, a risk management process is employed. The bushfire risk analysis process is an important part of this strategy as it aims to not only determine the spatial extent of the risk, but also quantify the risk, such that fire managers can make informed decisions whether to accept or treat the risk. As improvements in data quality and technology arise, risk related questions are becoming more complex and multi-faceted, thus the bushfire risk analysis process is evolving. Shields & Tolhurst (2003) introduced a contemporary integrated approach to bushfire risk analysis, incorporating the dynamic effects of bushfires. This study develops a method of practically implementing this approach using currently available data. A worked example for the greater Hobart area is provided using ignition, fire behaviour and fire propagation models along with climate, fuel, terrain, historical ignition and asset data in a Geographical Information System (GIS) environment. Bushfire RiskAn Integrated Approach Using GISSchool of Geography & Environmental StudiesDale Atkinson with assistance from Dr. Volker Janssen, Dr. Arko Lucieer and Mr. Mark Chladil Average probability of reaching the urban interface for each fire weather condition Example of the simulation system output using time contours • BUSHFIRE RISK Consequence Layer and Final Risk Results A layer was produced using dwelling density to model the potential consequence of a fire spreading into the urban environment. To allow for risk decision making, a risk index is defined, given by the below equation: A detailed view of the risk index of an area near Final Risk Map Mt Nelson. Risk is defined as “the chance of something happening that will impact on objectives”. It is measured in terms of consequences and likelihood (Standards Association of Australia & Standards New Zealand 2004). Applying this to bushfires, the likelihood component is the probability of a fire start (ignition) and spread (growth) and the consequence component is the impact of this fire starting and spreading • RESULTS Probability of Ignition Tasmania Fire Service incident data was examined for the seven year period between 1 July 1998 and 30 June 2005. Since the vast majority of data was related to ignitions from human activity, human accessibility in the study area was investigated. An ignition model was produced and validated using historical data . • DISCUSSION Relationship of Human accessibility and previous ignitions Results of the Validation This study has effectively developed a method for the implementation of the bushfire risk framework introduced by Shields & Tolhurst (2003), using currently available data. A worked example using the greater Hobart area was used to show the effectiveness of the method for local to regional scale areas. The spatial extent and quantification of the bushfire risk in the Hobart area were successfully identified. Although further refinement to the method and improvements to the input datasets are necessary, this assessment may be used as a first pass estimation in the bushfire risk management process. This study has provided a template for future studies to be conducted and resolved many of the implementation issues involved with dynamic risk modelling. In conclusion, the method presented in this study has shown that the approach developed by Shields & Tolhurst and later refined by Shields (2004) can be implemented effectively and produce some valid output in order to assess the risk of bushfire. With some improvements to the input data in order to minimise uncertainty, this model could be implemented as a decision making tool to contribute to a more effective bushfire risk management process. • REFERENCES Shields, BJ 2004, State of Knowledge Bushfire Risk Management, Department of Urban Services Canberra. Shields, BJ & Tolhurst, K 2003, 'A Theoretical Framework for Wildfire Risk Assessment', paper presented to Proceedings of 3rd International Wildland Fire Conference, Sydney. Standards Association of Australia & Standards New Zealand 2004, Risk management, Australian/New Zealand standard; AS/NZS 4360:1999, Standards Association of Australia, Strathfield, NSW. Probability of Ignition Layer- based on historical occurrence and distance from road


