Download
1 / 39
390 likes | 410 Views
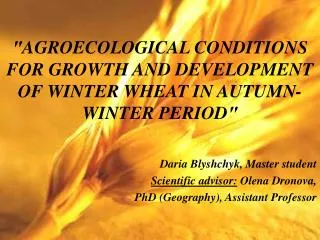
Learn about the effects of CO2 concentration on winter wheat growth, from fertilization to stomatal characteristics. Discover the ideal CO2 levels for maximizing plant growth and the impact of elevated concentrations. Dive into experimental methods, findings, and conclusions in this comprehensive study.

E N D
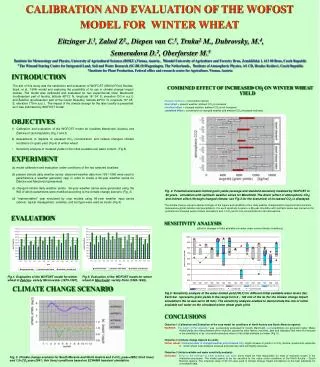
The Optimal Atmospheric CO2 Concentration For the Growth of Winter Wheat (Triticum aestivum) Ming Xu Rutgers University Chinese Academy of Sciences Email: mingxu@crssa.rutgers.edu Agri-2015, July 13-15, Beijing
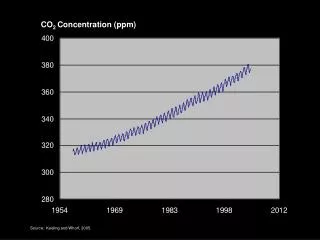
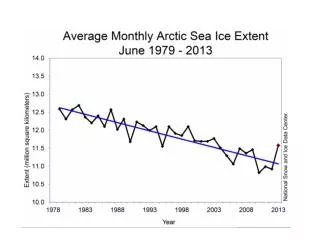
Atmospheric CO2 concentration: Past, present and future (Data from CMIP5-RCP8.5) of IPCC-AR5)
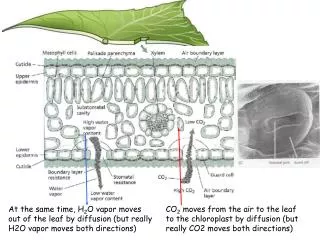
CO2 fertilization Effect: Food for Plants Photosynthesis CO2 + H2O (CH2O)n + O2 • Raw material for photosynthesis • Higher CO2 concentration higher reaction rate • Confirmed by experiments and models Respiration
Net Impacts CO2 fertilization effects Climate change impacts
? ? CO2 Fertilization Effect ? CO2 Concentration (ppm)
CO2 Fertilization Effect Up to 2300 ppm Amthor 2001 890ppm
PVC pipe wrapped with duct tape on dish Plants after germination (1 week) Environmental Growth Chamber Plants After Germination (2 weeks) 8 pots in each chamber
CO2 Controlling System Five growth chambers with CO2 concentration regulated to 400, 600, 800, 1000, and 1200 ppm with CO2 tanks (high purity 99.99%) Growth chamber control loop
Other Environmental Factors • Temperature: 21oC • Humidity: 60-70% • Light intensity: 1000 μmol m-2 s-1PAR, 6am-8pm • Soil type: fritted clay • Water amount: 200 ml/pot, watered every other day • Water type: plain tap water • Fertilization: half-strength Hoagland’s solution once weekly
Plants After Germination (2 Weeks) Nail varnish mold peeled off with tweezers
Slide under Nikon Eclipse 80i Microscope Nail varnish mold is mounted onto clear microslide
Picture in Autodesk Inventor where stomata lengths are traced with Line Tool and dimensioned
Laboratory oven settings and values Thelco Laboratory Oven used to dry plant leaves
Effects of CO2 enrichment on biomass growth of winter wheat Xu 2015, J. Plant Physiology
Diminishing of CO2 fertilization effect with the increase of CO2 concentration
CO2effects on plant height and leaf characteristics of winter wheat
CO2 Effects on the Spatial Pattern of Stomatal Distribution on Leaf Surfaces
CO2 effects on net leaf photosynthetic rate under growth CO2concentrations
CO2 effects on stomatal conductance measured under growth CO2 concentrations
Conclusions Initial increase in atmospheric CO2 concentration dramatically enhanced winter wheat growth through the CO2 fertilization effect before reaching an optimum of about 900 ppm; Further increase in CO2 concentration beyond this concentration substantially decreased the plant growth; Elevating CO2 concentration not only reduced stomatal density, length and conductance, but also changed the spatial distribution pattern of stomata on leaves, leading to more regular patterns.
Acknowledgements Drs. Bingru Huang and Yali Song Drs. Patrick Burgess and Yunpu Zheng USDA-INFA ISE
THANK YOU ! 谢谢!