Download
1 / 43
430 likes | 516 Views
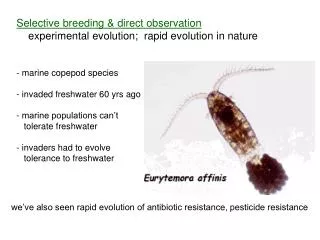
NSTX-U. Supported by . Experimental Observation of High-k Turbulence Evolution across L-H Transition in NSTX. Y. Ren 1

E N D
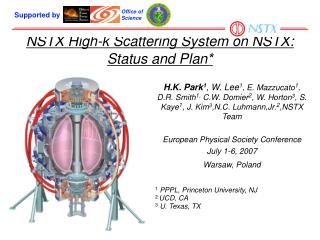
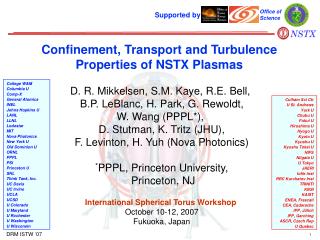
NSTX-U Supported by Experimental Observation of High-k Turbulence Evolution across L-H Transition in NSTX Y. Ren1 R.E. Bell1, Linming Shao2, D.R. Smith3, S. Zwenben1, W. Guttenfelder1, S.M. Kaye1, B.P. LeBlanc1, E. Mazzucato1, K.C. Lee4, C.W. Domier5, H. Yuh6and the NSTX Team 1. PPPL 2. ASIPP 3. UW-Madison 4. NFRI 5. UC-Davis 6. Nova Photonics Coll of Wm & Mary Columbia U CompX General Atomics FIU INL Johns Hopkins U LANL LLNL Lodestar MIT Lehigh U Nova Photonics Old Dominion ORNL PPPL Princeton U Purdue U SNL Think Tank, Inc. UC Davis UC Irvine UCLA UCSD U Colorado U Illinois U Maryland U Rochester U Tennessee U Tulsa U Washington U Wisconsin X Science LLC Culham Sci Ctr York U Chubu U Fukui U Hiroshima U Hyogo U Kyoto U Kyushu U Kyushu Tokai U NIFS Niigata U U Tokyo JAEA Inst for Nucl Res, Kiev Ioffe Inst TRINITI Chonbuk Natl U NFRI KAIST POSTECH Seoul Natl U ASIPP CIEMAT FOM Inst DIFFER ENEA, Frascati CEA, Cadarache IPP, Jülich IPP, Garching ASCR, Czech Rep 2014 U.S. Transport Task Force Workshop, San Antonio, Texas, April 22-25, 2014 TexPoint fonts used in EMF. Read the TexPoint manual before you delete this box.: A
Highlights • First detailed measurement of high-k (electron-scale) turbulence across L-H transition in NSTX • L-H transition at current flattop • Measuring 3 ≤ k┴ρs ≤ 12 in the core-edge transition region (r/a ~ 0.7-0.8) • High-k turbulence quasi-stationary before L-H transition, intermittent after L-H transition and significantly suppressed ~15 ms after L-H transition • Suppression of high-k turbulence at lower wavenubmer, i.e. k┴ρs ≤ 9 • Low-k turbulence measured by GPI and BES at different radii but similar temporal behavior with high-k measurement • Showing suppression of low-k turbulence into H-mode at r/a>0.8 • Linear stability analysis using GS2 code showing some consistency with turbulence measurements • Decreased ETG growth rate into H-mode • Low-k turbulence more suppressed by ExB shear into H-mode
A High-k Microwave Scattering System was Used to Measure Electron-Scale Turbulence • 280 GHz microwave is launched as the probe beam. • Coherent scattering by plasma density fluctuations occurs when the three-wave coupling condition is satisfied: • Bragg condition determines kp: • kp=2kisin(θs/2) • The scattered light has a frequency of: • ωs=ωp+ωi • with ωs and ωi >> ωp • The scattering system characteristics are: • Frequency bandwidth: 5 MHz • Heterodyne receiver: Wave propagation direction resolved • Measurement: kr spectrum • Wavenumber resolution: 0.7 cm-1 (2/a with a ≈ 3 cm) • Wavenumber range (kr): 5-30 cm-1 (~5-30 ) • Radial resolution: ±2 cm • Tangential resolution: 5-15 cm • Radial range: R=106 – 144 cm • Minimal detectable density fluctuation: Spherical mirror Scattered light kp + = kp θs 2a ks ks Probe beam Probe beam D.R. Smith, PhD thesis, 2009 ki ki
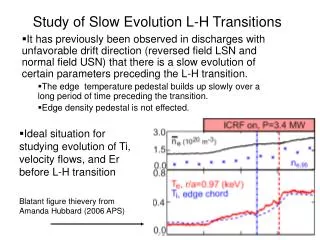
L-H Transition is Triggered by NBI Power Step-up during Current Flattop Shot=139442 BT=5.5 kG • L-H Transition at current flattop reduces measurement complications • Better high-k measurement due to favorable Doppler frequency shift • Less MHD activity L-H transition From TRANSP
L-H Transition is Triggered by NBI Power Step-up during Current Flattop Shot=139442 BT=5.5 kG • L-H Transition at current flattop reduces measurement complications • Better high-k measurement due to favorable Doppler frequency shift • Less MHD activity Time range of interest L-H transition From TRANSP
D Dithering is Observed after the L-H Transition at t≈350 ms • Spikes in divertor D after the L-H transition show the dithering feature of the L-H transition • Low-f MHD activity is relatively benign after the L-H transition High-k measurement region (r/a~0.7-0.8) L-H transition D-alpha dithering LCFS at R=146 cm
Edge Transport Barrier (ETB) is Established after the Dithering Phase • Clear H-mode density ear appears at t=365 ms, showing the establishment of ETB • The density ear from edge accumulation of carbon impurity High-k measurement region (r/a~0.7-0.8) L-H transition LCFS at R=146 cm
Edge Transport Barrier (ETB) is Established after the Dithering Phase • H-mode pedestal continuously builds up after the dithering phase • Electron density and temperature increase • High-k scattering system measures turbulence k spectrum at r/a~0.7-0.8 and ETB is at r/a>0.9 High-k measurement region (r/a~0.7-0.8) LCFS at R=146 cm
Clear Suppression of High-k Turbulence into L-H Transition from the High-k Scattering System • Off-center peak denotes the scattered signal • f=0 peak is from stray radiation L-H transition
Clear Suppression of High-k Turbulence into L-H Transition from the High-k Scattering System • Dithering in high-k spectral power observed after L-H transition • Off-center peak denotes the scattered signal • f=0 peak is from stray radiation L-H transition Dithering Dithering
Clear Suppression of High-k Turbulence into L-H Transition from the High-k Scattering System • Dithering in high-k spectral power observed after L-H transition • Significant suppression of turbulence in 365<t<380 ms • Off-center peak denotes the scattered signal • f=0 peak is from stray radiation L-H transition
Clear Suppression of High-k Turbulence into L-H Transition from the High-k Scattering System • Dithering in high-k spectral power observed after L-H transition • Significant suppression of turbulence in 365<t<380 ms • Some increase in turbulence at t>380 ms • Off-center peak denotes the scattered signal • f=0 peak is from stray radiation L-H transition
Broad Band High-k Turbulence is Seen across the L-H Transition • Frequency spectra are shown for an exact Thomson time point: t=348 ms • Mean real frequency much smaller than Doppler frequency shit Electron direction
Broad Band High-k Turbulence See across the L-H Transition • Frequency spectra are shown for an exact Thomson time point: t=365 ms • Turbulence propagates in the electron diamagnetic direction Electron direction
Broad Band High-k Turbulence See across the L-H Transition • Frequency spectra are shown for an exact Thomson time point: t=382 ms • Real frequency distinguishable from the Doppler frequency shift for channel 3 Electron direction
High-k Turbulence Changes in Amplitude and Frequency across the L-H Transition
Significant Drop of Spectral Power in Lower Wavenumber is Observed in the High-k Spectrum • No large variation before the L-H transition • Significant drop, i.e. a factor of about 7, in peak spectral power at t=365 ms after the L-H transition • Even smaller at 382 ms
Significant Drop of Spectral Power in Lower Wavenumber is Observed in the High-k Spectrum • No large variation before the L-H transition • Significant drop, i.e. a factor of about 7, in peak spectral power at t=365 ms after the L-H transition • Evensmaller at 382 ms • The drop in spectral power only occurs at k┴ρs <9-10
Similar Observations in Spectral Power Drop in Lower Wavenumbers in Different NSTX Scenarios Ren et al., NF 2013 Before L-H transition NBI-heated L-mode Increase of ExB shear After L-H transition
Similar Observations in Spectral Power Drop in Lower Wavenumbers in Different NSTX Scenarios Ren et al., NF 2013 Before L-H transition NBI-heated L-mode Increase of ExB shear After L-H transition Ren et al., PRL 2011 NBI-heated H-mode Increase of density gradient
Similar Observations in Spectral Power Drop in Lower Wavenumbers in Different NSTX Scenarios Ren et al., NF 2013 Before L-H transition NBI-heated L-mode Increase of ExB shear After L-H transition Ren et al., PRL 2011 NBI-heated H-mode RF-heated L-mode Increase of density gradient RF heating turned-off
Similar Observations in Spectral Power Drop in Lower Wavenumbers in Different NSTX Scenarios • The drop in spectral power only occurs at k┴ρs <9-10 Ren et al., NF 2013 NBI-heated L-mode Ren et al., PRL 2011 NBI-heated H-mode RF-heated L-mode
Large Intermittency (Dithering) in High-k Turbulence from t=350 to 365 ms • Overall turbulence power decreases into H-mode • Off-center peak denotes the scattered signal • f=0 peak is from stray radiation
Large Intermittency (Dithering) in High-k Turbulence from t=350 to 365 ms • Overall turbulence power decreases into H-mode • Periods of minimum turbulence appear intermittently (~1-1.5 ms)
Large Intermittency (Dithering) in High-k Turbulence from t=350 to 365 ms • Overall turbulence power decreases into H-mode • Periods of minimum turbulence appear intermittently (~1-1.5 ms) • Fast decrease and rise of turbulence power in 0.5-1 ms
Large Intermittency (Dithering) in High-k Turbulence from t=350 to 365 ms is Similar to Divertor D • High-k turbulence intermittency is on the same time scale as the dithering of divertor D • A definite correlation is not yet established
Low-k Turbulence Measured by BES Shows Similar Temporal Behavior as High-k Turbulence • High-k channel 3 measuring k┴ρs ~6-7 is compared with BES measurement at R=142 cm (top of the H-mode pedetsal) L-H transtion High-k measurement region High-k channel 3 k┴ρs ~6-7 R=135.5-140 BES channel location A BES channel at R=142 cm
Low-k Turbulence Measured by BES Shows Similar Temporal Behavior as High-k Turbulence • High-k channel 3 measuring k┴ρs ~6-7 is compared with BES measurement at R=142 cm (top of the H-mode pedetsal) L-H transtion • Quasi-stationary turbulence before the L-H transition • from BES High-k channel 3 k┴ρs ~6-7 A BES channel at 142 cm
Low-k Turbulence Measured by BES Shows Similar Temporal Behavior as High-k Turbulence • High-k channel 3 measuring k┴ρs ~6-7 is compared with BES measurement at R=142 cm (top of the H-mode pedetsal) L-H transtion • Semi-stationary turbulence before the L-H transition • from BES • Reduced turbulence into H-mode • from BES High-k channel 3 k┴ρs ~6-7 A BES channel at 142 cm
Low-k Turbulence Measured by BES Shows Similar Temporal Behavior as High-k Turbulence • High-k channel 3 measuring k┴ρs ~6-7 is compared with BES measurement at R=142 cm (top of the H-mode pedetsal) • Semi-stationary turbulence before the L-H transition • from BES • Reduced turbulence into H-mode • from BES • Intermittent turbulence right after the L-H transition • t ~ 350-365 ms • Similar temporal intermittency in low-k and high-k High-k channel 3 k┴ρs ~6-7 A BES channel at 142 cm
Low-k Turbulence Measured by BES Shows Similar Temporal Behavior as High-k Turbulence • High-k channel 3 measuring k┴ρs ~6-7 is compared with BES measurement at R=142 cm (top of the H-mode pedetsal) • Semi-stationary turbulence before the L-H transition • from BES • Reduced turbulence into H-mode • from BES • Intermittent turbulence right after the L-H transition • t ~ 350-365 ms • Similar temporal intermittency in low-k and high-k High-k channel 3 k┴ρs ~6-7 A BES channel at 142 cm
GPI Measurements also Show Similar Overall Temporal Behavior as the High-k Turbulence L-H transtion • is the RMS value of the GPI emission fluctuation over every 0.13 ms • is the mean of the GPI emission over every 0.13 ms GPI emission at R=144 cm
GPI Measurements also Show Similar Overall Temporal Behavior as the High-k Turbulence • Quasi-stationary turbulence before the L-H transition L-H transtion • is the RMS value of the GPI emission fluctuation over every 0.13 ms • is the mean of the GPI emission over every 0.13 ms GPI emission at R=144 cm
GPI Measurements also Show Similar Overall Temporal Behavior as the High-k Turbulence • Intermittent and decreasing turbulence right after the L-H transition L-H transtion • is the RMS value of the GPI emission fluctuation over every 0.13 ms • is the mean of the GPI emission over every 0.13 ms GPI emission at R=144 cm
GPI Measurements also Show Similar Overall Temporal Behavior as the High-k Turbulence • Suppressed turbulence in 365 ms<t<380 ms L-H transtion • is the RMS value of the GPI emission fluctuation over every 0.13 ms • is the mean of the GPI emission over every 0.13 ms GPI emission at R=144 cm
GPI Measurements are more Intermittent than the High-k Turbulence L-H transtion • is the RMS value of the GPI emission fluctuation over every 0.13 ms • is the mean of the GPI emission over every 0.13 ms GPI emission at R=144 cm
Equilibrium Profiles Changes can be Significant across the L-H Transition • ~30% decrease in normalized inverse ETG scale length • ~30% variation in decrease in normalized inverse ITG scale length • Significant decrease in density gradient • Significant increase in Te, Ti and ne (~45-60%) The time of L-H transition Quantities averaged in the high-k measurement region
Linear Stability Analysis Shows that ITG and ETG are both Unstable • ETG linear growth rates decrease into H-mode • ETG mode real frequency increases • ITG growth rates vary much less significantly Before L-H transition R=138 cm ETG ITG • Stability Analysis was performed with the GS2 code (Kotschenreuther et al., 1995) with Miller local equilibrium
ETG Stability across L-H Transition is Consistent with Measured High-k Turbulence Variation • ETG linear growth rates decrease into H-mode • Measured high-k turbulence also decreases into H-mode • The observed intermittency requires nonlinear processes R=138 cm ETG ITG • Stability Analysis was performed with the GS2 code (Kotschenreuther et al., 1995) with Miller local equilibrium
ETG Close to Marginal Stability in the High-k Measurement Region Further into H-mode • The decrease of ETG linear growth rates is due to the decrease of ETG and increase of critical temperature gradient The time of L-H transition R=138 cm ETG ITG • Stability Analysis was performed with the GS2 code (Kotschenreuther et al., 1995) with Miller local equilibrium
Ion-scale Modes are more Suppressed into H-mode • !E£ B,WM /°maxis used to assess ExB shear effect on ion-scale instabilities • !E£ B,WM /°max increases in the high-k measurement region into H-mode R=138 cm After L-H transition ETG ITG Before L-H • Stability Analysis was performed with the GS2 code (Kotschenreuther et al., 1995) with Miller local equilibrium
Summary • First detailed measurement of high-k (electron-scale) turbulence across L-H transition in NSTX • Quasi-stationary high-k turbulence before L-H transition, intermittent after L-H transition and significantly suppressed ~15 ms after L-H transition • Suppression of high-k turbulence at lower wavenubmer, i.e. k┴ρs ≤ 9, similar observations in different NSTX scenarios • Low-k turbulence measured by GPI and BES at different radii but similar temporal behavior as high-k turbulence observed • Intermittency observed after L-H transition, similar to high-k turbulence • Showing suppression of low-k turbulence into H-mode at r/a>0.8 • Linear stability analysis using GS2 code showing some consistency with turbulence measurements • Decreased ETG growth rate into H-mode • Low-k turbulence more suppressed by ExB shear into H-mode • Nonlinear processes needed for explaining the observed intermittency Acknowledgement: Work supported by DoE