Download
1 / 14
160 likes | 286 Views
This study presents a forecasting method that determines the threat level of coronal mass ejections (CMEs) using a free-energy proxy from active solar regions. By analyzing a database of 40,000 magnetograms spanning 1996-2004, we establish a statistically significant relationship between magnetic size, twist, and free energy within active regions. The forecasting tool has been validated against actual CME and flare rates, showing promising accuracy. Transitioning from MDI to HMI data aims to enhance forecast precision, ultimately improving solar event tracking for space weather predictions.

E N D
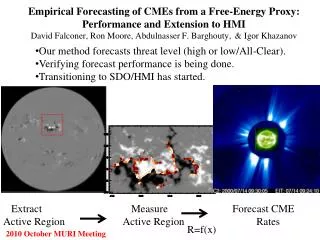
Empirical Forecasting of CMEs from a Free-Energy Proxy:Performance and Extension to HMIDavid Falconer, Ron Moore, Abdulnasser F. Barghouty, & Igor Khazanov • Our method forecasts threat level (high or low/All-Clear). • Verifying forecast performance is being done. • Transitioning to SDO/HMI has started. Extract Measure Forecast CME Active Region Active Region Rates R=f(x) 2010 October MURI Meeting
- + - + Relation between Size, Twist, and Free Energy of an Active Region’s Magnetic Field More Less Free Magnetic Twist Size Energy ~(Twist x Size)
WLSS Magnetic Measures WLSG
Active-Region Magnetic Measures Vector measures (SDO/HMI) Magnetic Size Φ=∫|Bz| da (|Bz| >100G) Free Magnetic Energy Proxy WLSG= ∫(Bz) dl (potential Bh>150G) Where Bz is the vertical field and Bh is the horizontal field. In the line-of-sight approximation (SOHO/MDI) Bz is replaced by the line-of-sight field and Bh is replaced by the potential transverse field which is calculated from the line-of-sight field
Only Big Twisted Active Regions Produce CMEs * Produced CMEs in 24 hours * No CMEs in 24 hours A Productive Active Region has: • Large amount of free energy • Large magnetic size • Large magnetic twist • Similar tendencies for production of X and M flares. Database • 40,000 Magnetograms • From 1,300 active regions • 1996-2004 • Known flare/CME/SPE history Measure of Active Region Magnetic Size Proxy of Active-Region Magnetic Free Energy
Empirical Conversion Functions • We have determined event rates as a function of our free-energy proxy, for several types of events. • The sample is divided into 40 equally populated bins using the magnitude of our free-energy proxy. • For each bin, the average observed 24-hour event rate is determined, with uncertainties. • The event rates for bins with event rates of >0.01 events/day are fitted with a power law. • This fit is used for converting our free-energy proxy to expected event rate. • Event rates can be converted into a event probability. Event Rate LWLSG(G) Proxy of Free Energy R=A(LWLSG)B P(t)=100%(1-e-Rt)
Forecasting Tool • A beta tool has been delivered to NASA SRAG, for MDI data. • AFRL is looking at the tool. • Paper submitted to Space Weather Event Rate LWLSG(G) Proxy of Free Energy When there are no active regions on the disk that is threatening to produce a powerful, earthward directed CME, then solar wind modeling at L1 is easiest.
Verification of Forecasting Curve using our Database Test 1: X&M flare forecast rates versus actual rate • We obtain forecast curves from the first three fourths of the active regions to forecast the performance of the remaining fourth of the active regions, and compare the forecast to actual performance. • We have binned our test sample into 10 bins of expected event rates. For each bin, we plotted the average forecasted and actual event rates. • The plot shows the actual rates in the five bins having event rates above 0.01 events/day along with the statistical uncertainties. • The five data-points fall along the unity line, verifying the forecast technique. Actual Rate Expected Rate
Truth TablesTest 2: Predictive Skill Scores and comparison to present McIntosh method Same division as previous X and M flares are used since they are the most frequent kind of event, and best identified with individual active regions.
Skill scores are various measures of how reliable a forecast is. The first four scores are based on yes/no forecast, with a forecasted event rate of 0.5/day or greater being counted as a yes forecast, while an event rate of less than 0.5 events/day is counted as a no forecast. The quadratic (Brier) score and SS are a comparison between the forecasted rates (fi) and the observed flare rate (σi), while QR* is the quadratic score if the average flare rate is used (Balch, 2008, Spaced Weather Vol 6). Skill Scores from Truth Table Our skill scores are always significantly better than McIntosh skill scores. QR*=(1/N)∑(σ-σi)2=0.17 E=((A+B)(A+C)+(B+D)*(C+D))/N
Steps in Transitioning from MDI to HMI • HMI to “MDI” conversion of free-energy proxy. • Deproject active region to accurately measure further from disk center, than is possible with MDI. • Use HMI’s higher resolution, higher cadence and full-vector measurements to improve forecast.
Using HMI to Forecast CME Rate from MDI Forecast Curve Knowing that RCME=F(WLSG-MDI) and WLSG-MDI=G(WLSG -HMI) we can use HMI to predict CME rate. To determine G, we first calibrate HMI to MDI Gauss units. Then determine G. Preliminary result is that we can estimate WLSG MDI to within 10% using HMI.
Summary • Free-energy proxies are strong predictors of future flare and CME activity. • Initial verification has been done. Misty Crown at AFRL is conducting an independent verification. • Transitioning to HMI from MDI has begun, the preliminary results indicate negligible increase in uncertainty in forecast event rates. • Not shown, adding GONG as a backup instrument has begun, forecast uncertainties will be larger, but GONG’s global-network of 6 ground based sites will guarantee backup capability to forecasters.
Forecasting Tool Work to do