Download
1 / 40
480 likes | 721 Views
Horse Related Injuries. Sonya Melville, MD University of Kentucky Chandler Hospital. Purpose. To understand the incidence and prevalence of horse related injuries occurring in Kentucky and the U.S.

E N D
Horse Related Injuries Sonya Melville, MD University of Kentucky Chandler Hospital
Purpose • To understand the incidence and prevalence of horse related injuries occurring in Kentucky and the U.S. • To compare horse related injury patterns from the World Equestrian Games in fall 2010 to previous data. • To identify injury patterns associated with horse related injuries.
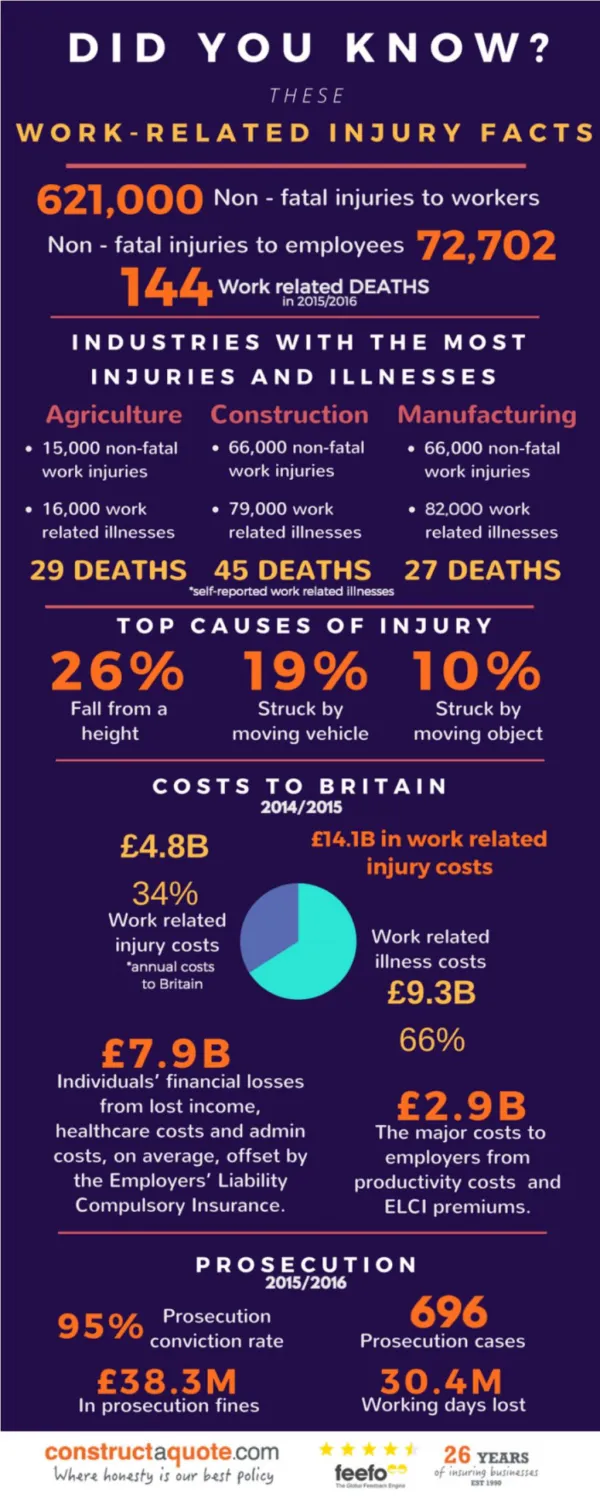
Background • 5,003 horse- related injuries in the United States 2002-2004. • Contusion/Abrasion 31% • Fractures 28% • Sprains/Strains 18% • Traumatic Brain Injury (TBI) 12% • Lacerations 6% (Loder, 2008)
Horse-related injury • Fractures and TBI cause of hospital admission • TBI most common injury when no helmet worn by rider • Cost of TBI associated with horse related head injuries from $600,000 to 1.8 million (Mayberry et al., 2007)
Causality of Horse Related Injury • Lack of protective gear- helmets in particular • 27% of injuries to riders were due to demands the rider was placing on the horse - - that is asking the horse to perform a maneuver outside of its skill set • Half of the patients in the study believed the injuries were preventable and were the fault of the rider (Ball and Ball, 2007)
UK Data Analysis • Retrospective review using trauma registry data. • IRB approval obtained
Specific Aims: • Define the incidence and prevalence of horse related human injuries seen at the University of Kentucky. • Compare the UK incidence and prevalence of horse related human injuries to the United States incidence and prevalence. • Identify at least 2 strategies to reduce the incidence of horse related human injuries. 2
Sample • All patients entered in the UK Trauma Registry Data Base from 2006-2008 with horse related injuries. • All trauma patients 2006-2008 N = 8668 • Horse related injuries 2006-2008 n = 223 (UK Trauma Registry, 2009)
Patients Hospitalized at UK HealthCareFirst Seen in the Emergency Department fora Horse-Related Injury 2006 2007 2008 (UK Trauma Registry, 2009) 4
Cause of Injuries of Patients Admitted to UK Hospital via Emergency Department (UK Trauma Registry, 2009) 5
Examples of Typical Horse-Related PatientInjuries Requiring Hospitalization • Crushed spine/spine fractures • Broken shoulder blades • Liver lacerated • Bruised, bleeding, punctured lungs • Right rib fractures • Chest bone dislocated • Collarbone fractures • Broken/fractured arms, legs, hands, feet • Traumatic brain injury (TBI) • Fractured cheek • Fracture eye socket • Nose fracture • Fractured jaw (UK Trauma Registry, 2009) 6
Cause of Hospitalization of Patient with Horse-Related Injuries at UK (UK Trauma Registry, 2009) 7
Top Ten Sports for Traumatic Brain Injuries Percentage of emergency department visits for nonfatal traumatic brain injuries by activity: • Horseback riding 11.7% • Ice skating 10.4% • All-terrain vehicles (ATV’s) 8.4% • Sledding 8.3% • Bicycling 7.7% • Hockey 7.4% • Playground 7.1% • Moped/dirt-bike 6.6% • Golf 6.6% • Amusement Parks 6.5% (CDC, 2007) 3
Implications • TBI risk increases without helmet. • Protective Gear needs to be worn at all times by all riders. • Injury Prevention Education essential. • Equestrian professional associations must require appropriate protective apparel.
The WEG and Injury Concerns • Simultaneous competitions • Competitive venues with athletes from around the world • Athletes had varying levels of skill • Length of event had the potential to increase injuries seen • What is different about an equestrian athlete?
The Equestrian Athlete • Commonly exposed to repetitive trauma • Head and back injuries very common. • At least 13 riders in the past four years have been killed and several others seriously injured.
History of the Games • Prior to first WEG, each discipline held their own championships. • KY Horse Park hosted the Eventing World Championship in 1978. • The Championships were held every 4 years • The concept for the WEG was first proposed in 1983 • First WEG was help in Stockholm in 1990 • Six events: Jumping, Dressage, Eventing, Driving, Endurance and Vaulting • Reining was added in 2002 • Para Dressage is new this year to the competition • This will be the first time the games will be hosted outside of Europe.
Eventing • All around test for the horse and rider • Three Day Event comprises of • Dressage Test • Cross Country Test • Jumping Test (Stadium jumping)
Rider Outcome • Open Mandible Fracture • Rib Fractures with Bilateral Hemopneumothorax • Scapula and clavicle fractures • Facial Fractures • Discharged home after 17 days • Resumed riding shortly after injury
Protective Gear- Air Vest • Ripcord tethered to horse- when rider ejected/separated from horse air vest deployed. • Inflates when ripcord pulled from CO2 canister. • Difficult for the rider to breath when the vest inflates- need to release vest clips as soon as possible. • Example from Rolex 2010 – to follow
Lessons Learned • Main medical and satellite sites saw 956 patients- mostly minor complaints • 37 transports- mostly spectators • Trauma- spectator and athletes • Cross- country eventing- 8 falls • 3 athlete transports • 5 total athlete injuries over course of event- all non-life threatening
References Ball, C. E., Ball, J. E., Kirkpatrick, A. W., & Mulloy, R. H. (2007). Equestrian injuries, injury patterns, and risk factors for 10 years of major traumatic injuries. The American Journal of Surgery, 193 (5): 636-640. Carrillo, E.H., Varnagy, D., Bragg, S. M., Levy. J., & Riordan, K. (2007). Traumatic injuries associated with horseback riding. Scandinavian Journal of Surgery,96 (1): 79–82. Centers for Disease Control and Prevention. (2007). Nonfatal traumatic brain injuries from sports and recreation activities – United States, 2001-2005. Morbidity and Mortality Weekly Report, July 27, 2007: 29. Ceroni, D. (2007). Support and safety features in preventing foot and ankle injuries in equestrian sports. International Sports Medicine Journal,8(3):166-178. Loder, R. T. (2008). The demographics of equestrian-related Injuries in the United States: Injury patterns, orthopedic specific injuries and avenues for injury prevention. The Journal of Trauma, Injury, Infection and Critical Care, 65(2):447-460. Mayberry, J. C., Pearson, T.E., Wiger, K.J., Diggs, B. S., & Mullins, R. T. (2007). Equestrian injury prevention efforts need more attention to novice riders. The Journal of Trauma, Infection and Critical Care. 62(3):735-739. 17