Download
1 / 37
370 likes | 517 Views
21.1 Stocks. Read stock listings. Calculate and distribute dividends. Key Terms. Stock : the distribution of ownership of a corporation. Partial ownership can be purchased through various stock markets. Share : one unit of ownership of a corporation.

E N D
21.1 Stocks • Read stock listings. • Calculate and distribute dividends.
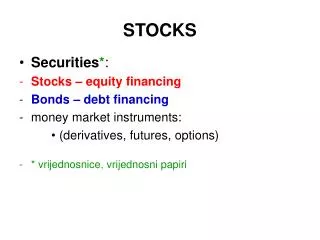
Key Terms • Stock: the distribution of ownership of a corporation. Partial ownership can be purchased through various stock markets. • Share: one unit of ownership of a corporation. • Face value (par value): the value of one share of stock at the time the company first issued stock for sale.
Key Terms • Stock certificate: a certificate of ownership of stock issued to the buyer. • Dividend: a portion of the profit of a company that is periodically distributed to the stockholders of a company. • Preferred stock: a type of stock that guarantees a specific dividend to the stockholder. The preferred stockholder does not have voting rights.
Key Terms • Common stock: a type of stock that gives the stockholder voting rights. After dividends are paid to preferred stockholders, the remaining dividends are distributed among common stockholders. • Stock market: the structure for buying and selling stock. • Trade: either the buying or selling of a stock.
Key Terms • Stockbroker: the person who handles the trading of stock. A stockbroker receives a commission for these services. • Stock listings: information about the price of a share of stock and some historical information that is published in newspapers and on the Internet. • Price-earning (PE) ratio: the ratio of closing price of a share of stock to the annual earnings per share.
21.1.1 Read Stock Listings • In the stock listing in Table 21-1 in your text, there are fifteen (15) columns across the top of the page and they identify specific information related to a particular stock. • Stock prices are listed in dollars and cents. • Positive and negative signs show the direction of the stock: “+0.13” means the stock went up thirteen cents over the previous day’s price. • The rows list the stock name in alphabetical order.
From Table 21-1 identify each column for ABN Amro Holding 1. Shows the corporation name: ABN Amro Holding 2. Shows the company symbol: ABN 3. Share price when the market opens: $48.60 4., 5.and 6. Show the high, low and close at which the stock sold this day: high is $49.07; low is $48.52; close is $48.74. 7: Shows how much this day’s closing price per share differs from the previous day’s closing price per share for this stock: net change is $0.29.
Identify each column (cont.) 8. Shows the percentage increase/decrease of day’s closing price to the opening price: 0.6% 9. Shows the total number of shares that are traded on this day: 1,598,100 shares 10. and 11. show the high and low price at which the stock was traded in the last 52 weeks, not including this day: high $50.83; low $25.43. 12. Shows the dividend paid per share of stock the previous year: an irregular cash dividend of $1.48 per share was paid last year. (An edenotes an irregular cash dividend)
Identify each column (cont.) 13. Yield shows the previous year’s dividend as a percent of the current price per share: yield is 3% (If there was no dividend paid the previous year, the entry is “…”) 14. Shows the stock’s price earnings ratio (PE): The P/E ratio is unchanged. 15. (YTD% Chg) shows the percentage by which the closing price differs from the first business day of the year: the price per sharerose 52%.
21.1.2 Calculate and Distribute Dividends • Corporation’s board of directors votes to reinvest any profits into a business or can declare a dividend with some or all of the profits. • Dividend can be expressed as a percentage of the par value of the shares, or as a dollar amount per share. • Usually declaredquarterly.
Key Terms • Participating preferred stock: a type of preferred stock that allows stockholders to receive additional dividends if the company does well. • Convertible preferred stock: a stock option that allows the stockholder to exchange the stock for a certain number of shares of common stock.
Key Terms • Cumulative preferred stock: preferred stock that earns dividends every year. • Dividends in arrears: dividends that were not paid in a previous year and must be paid to cumulative preferred stockholders before dividends can be distributed to other stockholders.
How to calculate and distribute dividends 1.First pay dividends in arrears: • Multiply the number of shares held by preferred stockholders by the given rate, expressed as dollars per share. • Subtract those dividends in arrears from the available amount of money (continued next slide)
Calculate and distribute dividends 2.Pay the present year’s preferred stock dividends: • Multiply the number of preferred shares held by stockholders by the given rate. • Subtract these preferred stock dividends from the difference from step 1b. (continued on next slide)
Finally… 3.Pay the common stock dividend: Divide the difference from step 2b by the number of common shares held by stockholders. This is the dividend per share paid to common stockholders.
Look at this example Your company has issued 20,000 shares of cumulative preferred stock that will earn dividends at $0.60 per share, and 100,000 shares of common stock. Last year, you paid no dividends. This year, $250,000 is available for dividends. How are the dividends to be distributed? (next slide)
Pay the stockholders • Pay last year’s dividends in arrears: 20,000 x $0.60 = $12,000 (to preferred stockholders) • Pay preferred stockholders for this year: 20,000 x $0.60 = $12,000 • The remaining amount ($226,000) is divided among the 100,000 shares of common stock yielding a payout of $2.26 per share. Preferred stockholders receive $24,000 and common stockholders receive $226,000.
Try this example The Puffer Fish Company has issued 10,000 shares of cumulative preferred stock that will earn dividends of $0.80 per share and 50,000 shares of common stock. Last year they paid no dividends. This year $100,000 is available for dividends. How are the dividends to be distributed? Preferred stockholders will receive $16,000 &common stockholders will receive $84,000, at $1.68 per share.
21.2. Bonds and Mutual Funds • Read bond listings. • Calculate the price of bonds. • Read mutual fund listings.
Key Terms • Bond: a type of loan to the issuer to raise money for a company or municipality. The investor or bondholder will be paid a specified rate of interest each year and will be paid the entire value of the bond at maturity. • Face value (par value): the original value of a bond, usually $1,000. • Maturity date: the date at which the face value of the bond is paid to the bondholder.
Key Terms • Junk bonds: high-risk bonds that are usually from companies in bankruptcy or in financial difficulty. • Corporate bonds: bonds issued by a business. • Municipal bonds: bonds issued by local and state governments. • Treasury bonds: bonds issued by the federal government.
Key Terms • Couponbonds: bonds that require the investor to submit a coupon at a specified time to receive interest. • Registered bonds: investors receive interest automatically by being listed with the company. • Convertible bonds: bonds with a provision for being converted to stock. • Callable bonds: bonds that can be repurchased by the company before the maturity date.
Key Terms • Bond market:the structure for buying and selling bonds. • Premium bond:a bond that sells for more than the face value. • Discount bond: a bond that sells for less than the face value.
21.2.1 Read Bond Listings • There is less activity in the bond market, so prices are given weekly. • CLS: closing price • 100% means bonds selling at par value • Discount bonds have a listing of less than 100% • Premium bonds have a listing of greater than 100%
How to read bond listings • There are nine columns in all. • Columns 1 and 2 give the high and low values over the past twelve months. • Column 3 tells the name of the issuing company, the annual interest rate (expressed as percent of face value) and the last two digits of the year of maturity. • Column 4 (Cur Yld) tells the current yield which is the ratio of the annual interest earned per bond and the current price per bond.
Read bond listings (cont.) • Column 5 (Sales) tells the amount of sales in $1,000’s. • Columns 6 and 7 give the weekly high and low values. • Column 8 (Weekly Last) tells the closing price per bond as a percent of the face value per bond. • Column 9 (Net Change) tells how much this week’s closing price per bond differs from the previous week’s closing price per bond.
21.2.2 Calculate the Price of Bonds • Locate the percent of $1,000 that the bond was selling for at the close of the week (column 8). • Multiply the decimal equivalent of the percent by $1,000. • Round the product to the nearest cent.
Key Terms • Yield: a measure of the profitability of the investment. • Current bond yieldoraverage bond yield: the annual interest per bond to the current price per bond.
Look at this example • Calculate the closing price of PhilPt bond. • From column 8, the closing price as a percent of face value was 103.13% which is equal to 1.0313. • Closing bond price = $1,000 x 1.0313 • The closing bond price is $1,031.30
21.2.3 Read Mutual Fund Listings 1. Find the appropriate fund family (bold entry in column 1). 2. Find the appropriate fund name (indented entry in column 1). 3. Find the mutual fund symbol in column 2. 4. Find the net asset value (NAV) in column 3. 5. Identify the one-day total change (Chg) from column 4. 6. Identify the total return for the year to date (YTD % Ret) from Column 5.
Key Terms • Portfolio: a variety of types of investments • Mutual fund or investment trust: a collection of stocks, bonds, and other securities that is managed by a mutual fund company • Net asset value: the value of one share of the fund. This value fluctuates just as the value of stocks and bonds fluctuates.
Look at this example Find the (a) current price per share of LCEDX fund. What was (b) the price per share yesterday? (a) current price per share = $14.09 (NAV) (b) yesterday’s price = $14.09 - $0.05 = $14.04 • Yesterday’s price per share was $14.04.
How to find the NAV at the beginning of the year for a mutual fund 1. Divide the current NAV by the sum of: 100% and YTD% return. Beginning of year NAV = current NAV 100% + YTD% return 2. Round the quotient to the nearest cent.
Look at this example Using Table 21-3, find the beginning of year NAV for AWSBX. Beginning of year NAV = current NAV 100% + YTD% Beginning of year NAV = 16.48 1.048 • The beginning of year NAV = $15.73.