Download
1 / 23
230 likes | 251 Views
A study on the impacts of climate change across sectors like agriculture, sea level rise, biodiversity, and more on a global scale, highlighting increasing damages with rising global mean temperature. The research identifies key factors affecting results and proposes continuous monitoring for better mitigation strategies.

E N D
Estimating the Global Damages from Climate Change Joel Smith and Sam Hitz Stratus Consulting Inc. October 23, 2002
Objective • Effort to identify benefits from different greenhouse gas emissions policies • key issue is identification of marginal benefits (avoided damages); are they: • constant • decreasing • reverse sign? • provide useful input for examining long run goals • Did not address the costs of mitigation
Overview • We surveyed published sectoral studies that quantify the global impacts of climate change. • Limited ourselves to global studies; did not examine regional impacts literature • Characterized the relationships between climate change and impacts based on studies results • increasing impacts • parabolic • indeterminate • Identified key factors and assumptions in these studies that could substantially affect results • inclusion and correctness
Methodology and Approach • Global mean temperature (GMT) used as indicator of climate change • recognize the many caveats with doing so • Use equilibrium (generally older studies) and transient (generally newer studies) results • Used metrics employed by authors of individual studies. No attempt to aggregate. • Identified and analyzed key factors, assumptions and framework upon which studies were based.
Published Studies Agriculture Sea Level Rise Water Resources Human Health Terrestrial Ecosystems Forestry Marine Ecosystems Biodiversity Energy No Global Studies Recreation and Tourism Transport Building Insurance Human Amenity Mitigation Sectors Impacted by Climate Change
Presentation • Results from agriculture, coastal resources, biodiversity and water sector are representative of these categories.
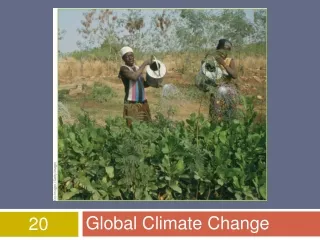
AgricultureRosenzweig et al., 1995Percent Change in Number of People at Risk of Hunger (2060)
AgricultureParry et al., 1999Percent Change in Number of People at Risk of Hunger
Agriculture Conclusions • Results suggest initial benefits that eventually decrease and give way to damages as GMT rises, or alternatively, initial damages that decrease before continually rising. • Some disagreements at lower temperatures, but eventually increasing damages beyond 3-4° C. • This result agrees with expectation based on underlying biophysical processes.
Coastal ResourcesFankhauser, 1995.Cost of Sea Level Rise in OECD Countries
Coastal ResourcesNicholls et al., 1999Additional People in the Hazard Zone as a Function of SLR
Coastal Resources Conclusions • Damages seem to increase linearly with SLR. • This result is in line with expectations of monotonically rising costs. • These costs likely to continue accruing well into the next century, as sea level continues to rise, even after CO2 stabilizes.
BiodiversityHalpin, 1997.Percent Change in Eco-Climatic Classes for Biosphere Reserves Compared to Global Average
Biodiversity • Eco-climatic classes change within global bio-reserves with greater frequency as GMT rises. • There is little reason to doubt this result. It would be difficult to argue that climate change will slow the loss of threatened species. • This is mentioned because even loss of individual species or ecosystems could be motivation for mitigation.
Water ResourcesArnell, 1999.Change in Number of People in Countries in Water Stress
Water ResourcesArnell, 1999.Difference Between Total Population in Countries Where Water Stress Increases and Countries Where Water Stress Decreases
Water Resources Conclusions • No clear relationship between climate change and impacts on water resources. • Averaging at the regional or country level presents problems. Basin level is more appropriate. • We think there should be increasing damages with increasing GMT. • Not (yet) borne out by published literature.
Limitations • Did not consider: • impacts of temperature changes in excess of 1.4 to 5.8° C range considered likely by Houghton et al.,2001 • change in climate variability • impacts due to long term (i.e. post 2100) climate change • potential large scale singular events (e.g. collapse of THC or WAIS) • interaction among impacts on different sectors (e.g. water and agriculture) • ancillary benefits and proactive adaptation.
Limitations • Also: • Adaptation generally handled with simplistic assumptions • can over or underestimate impacts • Assumptions about population and development not consistent • development can make substantial difference in vulnerability of societal sectors
Conclusions • In all sectors, the results point to increasing damages beyond a temperature range of 3-4°C. • Below this critical temperature range, the picture is much less clear. In some sectors damages may accrue immediately and continue to grow. In others, benefits may eventually give way to damages or initial damages may decrease before steadily increasing. • Aggregate studies we examined, tend to confirm this basic conclusion.
Final Caveats • Changes in the key assumptions and simplifications upon which each of the studies depend could either lower or raise this critical temperature range. (e.g. adaptation, development, treatment of variability, interaction among sectors, long-term temperature change or changes in the climate system) • We should expect significant variation among regional results. The critical temperature range we identify could be quite different depending on the particular combination of region and sector.