Download
1 / 93
930 likes | 962 Views
Learn about spectral clustering, addressing problems of K-means and optimal cluster separation in complex data distributions. Discover graph-based representations for relationship-focused data analysis.

E N D
Spectral Clustering Jianping Fan Dept of CS UNC-Charlotte http://webpages.uncc.edu/jfan/itcs4122.html
Inter-cluster distances are maximized Intra-cluster distances are minimized Key issues for Data Clustering Objective Function • Similarity or distance function • Inter-cluster similarity or distance • Intra-cluster similarity or distance • Number of clusters K • Decision for data clustering
Problems of K-means Summary of K-means • Locations of Centers • Number of Clusters K • Sensitive to Outliers • Data Manifolds (Shapes of Data Distributions) • Experiences Centers: random & density scan K: start from small K & separate iteratively; start from large K and merge sequentially Outliers:
Inter-cluster distances are maximized Intra-cluster distances are minimized Problems of K-MEANs Distance Function Geometry Distance Optimization Step: Assignment Step:
Problems of K-MEANs Similarity function cannot handle special data manifold effectively! Intra-cluster similarity and inter-cluster similarity are not optimized jointly or simultaneously! Pre-selected locations of cluster centers may not be acceptable!
K-Means Clustering Expected Achieved Why K-Means fails?
Why K-Means Clustering Fails? Expected Achieved Objective Function • Similarity or distance function • Inter-cluster similarity or distance • Intra-cluster similarity or distance • Number of clusters K • Decision for data clustering
Why K-Means Clustering Fails? Achieved Expected Number of clusters K may not be an issue here Objective function?
Why K-Means Clustering Fails? Expected Achieved Data Manifold: Relationship rather than distance Distance Function & Decision for Data Clustering
Key issues for Data Clustering • Inter-cluster similarity or distance • Intra-cluster similarity or distance • Number of clusters K • Decision for data clustering • Similarity or distance function
Lecture Outline • Motivation • Graph overview and construction • Spectral Clustering • Cool implementations
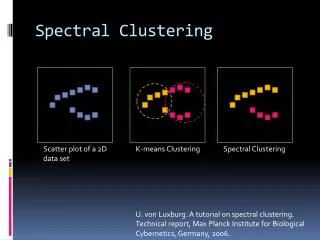
Dataset exhibits complex cluster shapes • K-means performs very poorly in this space due bias toward dense spherical clusters. In the embedded space given by two leading eigenvectors, clusters are trivial to separate. Spectral Clustering Example – 2 Spirals Relationship vs. Geometry Distance
Spectral Clustering Relationship Objective Function • Similarity representation • Inter-cluster similarity • Intra-cluster similarity • Number of clusters K • Decision for clustering
Graph-Based Similarity Representation---considering data manifold Geometry Distance vs. Relationship
Spectral Clustering Example Why k-means fails? Geometry vs. Manifold
Graph-Based Similarity Representation Distance vs. Relationship
Graph-Based Similarity Representation Distance vs. Relationship
Graph-Based Similarity Representation Distance vs. Relationship
Graph-Based Similarity Representation Number of clusters matters
Lecture Outline • Motivation • Graph overview and construction • Spectral Clustering • Cool implementation
Similarity (Relationship) Graph-based Representation of Data Similarity(Relationship)
Graph-based Representation of Data Relationships How to generate such graph for data relationship representation?
Lecture Outline • Motivation • Graph overview and construction • Spectral Clustering---considering intra-cluster similarity and inter-cluster similarity jointly! • Cool implementations
Key issues for Spectral Clustering Objective Function • Relationship function for Graph construction • Inter-cluster similarity or distance • Intra-cluster similarity or distance • Number of clusters K • Decision for data clustering
How to Do Graph Partitioning? Citation Group Identification
How to Do Graph Partitioning? Social Group Identification
How to Do Graph Partitioning? Hot Topic Detection
Spectral Clustering cut Intra-Cluster Similarity: Inter-Cluster Similarity:
Spectral Clustering Graphcut Objective Function for Spectral Clustering 1. Maximize Intra-Cluster Similarity 2. Minimize Inter-Cluster Similarity
Spectral Clustering Graphcut Objective Function for Spectral Clustering Min
Spectral Clustering Graphcut Clustering via Graph Cut on weak connection points: Minimize inter-cluster similarity