Download
1 / 4
40 likes | 67 Views
This assignment involves plotting stars on an HR diagram using graph paper. Learn about luminosity and spectral class while analyzing the properties of stars. Submit your completed diagram for assessment.

E N D
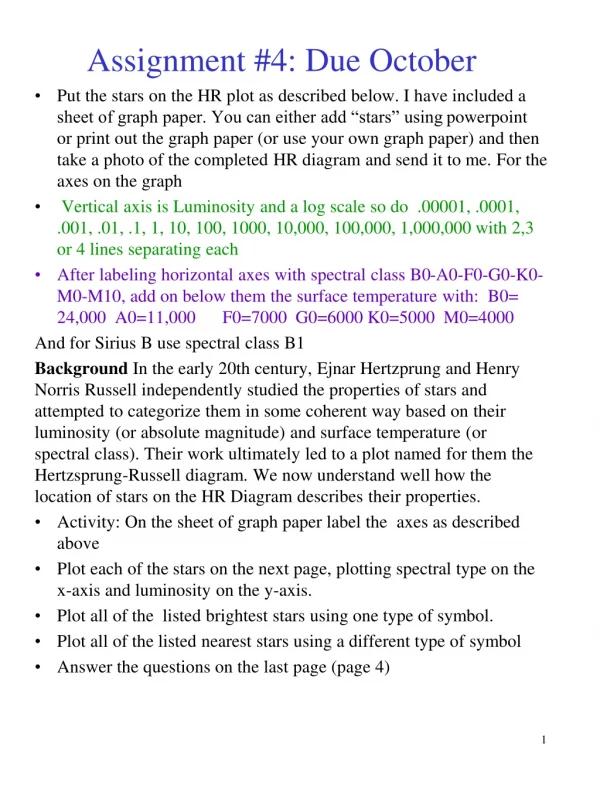
Assignment #4: Due October • Put the stars on the HR plot as described below. I have included a sheet of graph paper. You can either add “stars” using powerpoint or print out the graph paper (or use your own graph paper) and then take a photo of the completed HR diagram and send it to me. For the axes on the graph • Vertical axis is Luminosity and a log scale so do .00001, .0001, .001, .01, .1, 1, 10, 100, 1000, 10,000, 100,000, 1,000,000 with 2,3 or 4 lines separating each • After labeling horizontal axes with spectral class B0-A0-F0-G0-K0-M0-M10, add on below them the surface temperature with: B0= 24,000 A0=11,000 F0=7000 G0=6000 K0=5000 M0=4000 And for Sirius B use spectral class B1 Background In the early 20th century, EjnarHertzprung and Henry Norris Russell independently studied the properties of stars and attempted to categorize them in some coherent way based on their luminosity (or absolute magnitude) and surface temperature (or spectral class). Their work ultimately led to a plot named for them the Hertzsprung-Russell diagram. We now understand well how the location of stars on the HR Diagram describes their properties. • Activity: On the sheet of graph paper label the axes as described above • Plot each of the stars on the next page, plotting spectral type on the x-axis and luminosity on the y-axis. • Plot all of the listed brightest stars using one type of symbol. • Plot all of the listed nearest stars using a different type of symbol • Answer the questions on the last page (page 4)
HR Diagram Worksheet Questions • Is there a clear main sequence in your plot? Why does this not look quite like the HR Diagram in our lectures? 2. Where do you find most of the brightest stars in the diagram? What does this tell you about the brightest stars? 3. Where do you find most of the nearest stars in the diagram? What does this tell you about the nearest stars? 4. What are the two most distant stars listed above? Why are they still so bright?