Download
1 / 36
360 likes | 472 Views
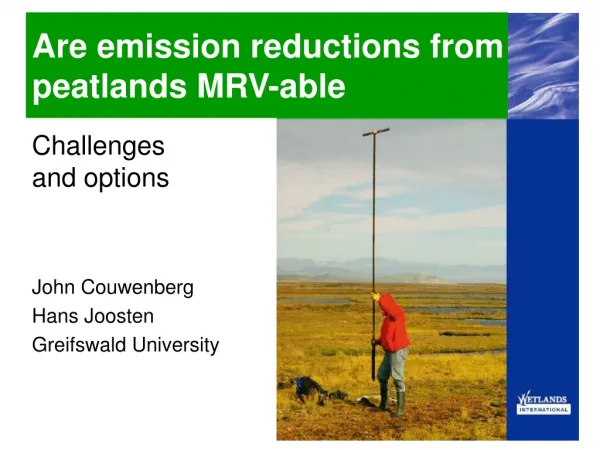
Are emission reductions from peatlands MRV-able. Challenges and options John Couwenberg Hans Joosten Greifswald University. Stocks & emissions. Current Carbon stock in peat soils: ~550 000 Mt C Current emissions from drained peatlands: >2000 Mt CO 2 y -1.

E N D
Are emission reductions from peatlands MRV-able Challenges and options John Couwenberg Hans Joosten Greifswald University
Stocks & emissions Current Carbon stock in peat soils: ~550 000 Mt C Current emissions from drained peatlands: >2000 Mt CO2 y-1
Mitigation management options • Conservation of the C stock • Sequestration of C from the atmosphere • Substitution of fossil materials by biomass.
Conservation management Conserve existing peat C pools: • Prevent drainage • Reverse drainage by rewetting
Reducing the rate of deforestation (rate of reclamation of new areas) yearly emissions time
Reducing the rate of peatland drainage (rate of reclamation of new areas) yearly emissions Peatlands continue emiting for decades after drainage:Annual emissions are cumulative time
Conservation management Rewetting is the only option to reduce emissions Strategic rewetting of 30% (20 Mio ha) of the world’s drained peatlands could lead to an annual emission avoidance of almost 1000 Mtons CO2 per year.
Sequestration management • ~75% of peatlands are still pristine • accumulating new peat • removing & sequestering 200 Mtons CO2 y-1 strict protection • rewet 20 Mio ha • restore peat accumulation in 10 Mio ha additional removal ~10 Mtons CO2 y-1
Substitution management • replacing fossil resources by biomass from drained peatlands: CO2 emitted > CO2 avoided • biomass from wet peatlands or paludiculture (= wet agriculture and forestry) • implemented on 10 Mio ha of rewetted peatland substitution of 100 Mtons of CO2
Peatland management • avoiding peatland degradation and • actively restoring peatlands • results in significant climate benefits quantify emission reductions
Proxies: water level Good proxy for CO2 emissions: Example temperate Europe 50 40 30 t CO2 ha-1 y-1 20 10 0 0 -20 -40 -60 -80 -100 -120 mean annual water level [cm]
Proxies: water level Good proxy for CH4 emissions: Example temperate Europe 600 12 500 10 400 8 -1 -1 y y -1 300 -1 6 ?ha -eq?ha 4 2 200 kg CH 4 t CO 100 2 0 0 -100 -80 -60 -40 -20 0 20 40 60 -100 -2 mean water level [cm]
3 2 1 0 15 -0,5 CH4 emission [mg m-2 h-1] 10 5 0 -100 -80 -60 -40 -20 0 20 water level [cm] Proxies: water level SEAsia Good proxy for CH4 emissions: Boreal/tempEurope At high water levels differences due tovegetation
Emissions strongly related to water level Vegetation strongly related to water level Use vegetation as indicator for emissions
Proxies: vegetation • developed for NE Germany • currently being verified, calibrated and updated for major peatland rewetting projects in Belarus.
Proxies: vegetation Advantages of using vegetation • reflects longer-term water level conditions • reflects factors that determine GHG emissions(nutrient availability, acidity, land use…), • itself determines GHG emissions (quality of OM, aerenchyma mediated CH4) • allows fine-scaled mapping (1:2,500 – 1:10,000)
Proxies: vegetation Disadvantage of using vegetation • slow reaction on environmental changes • necessity to calibrate for different climatic and phytogeographical conditions.
GESTs: Greenhouse gas Emission Site Types
GESTs with indicator species groups GEST: moderately moist forbs & meadows • Vegetation forms: • Urtica-Phragmites reeds • Acidophilous Molinia meadow • Dianthus superbus-Molinia meadow • … Each with typical / differentiating species Each GEST with GWP
Proxies: subsidence • loss of peatland height due to oxidation • complication: consolidation, shrinkage • promising especially in the tropics:subsidence based methodology being developed by the Australian-Indonesia Kalimantan Forests Carbon Partnership.
90 10 9 80 8 70 7 60 subsidence [cm y-1] 6 Estimated emission [t CO2 ha-1 y-1] 50 5 40 4 30 3 20 2 10 1 0 0 -40 -120 -100 -80 -60 -20 0 drainage depth [cm] Proxies: subsidence Oxidative componentderived from changesin bulk density andash content:
Proxies: subsidence • possible to measure using remote sensing and ground-truthing • works well for losses from drained peatlands, but less for decrease in losses under rewetting (swelling)
Monitoring emission reductionsfrom rewetting and conservation • wide range of land use categories • may require different approaches to • reduction of GHG emissions • monitoring these reductions • land use may enhance GHG emissions(plowing, fertilization, tree removal)
Monitoring emission reductionsfrom rewetting and conservation Avoided emissions need clear baseline • clear in case of rewetting • proxy approach for avoided drainage • Note: peat depth determines duration of possible emissions after drainage
Monitoring emission reductionsfrom rewetting and conservation • cost of monitoring is related to the desired precision of the GHG flux estimates. • determined by market value of ‘carbon’ • assessing the GHG effect of peatland rewetting by comprehensive, direct flux measurements might currently cost in the order of magnitude of € 10 000 ha-1 y-1
Monitoring by proxies Monitoring GHG fluxes using water levels: • data frequent in time, dense in space. field observations and automatic loggers. • water level modelling based on weather data • remote sensing not yet suited
Monitoring by proxies Monitoring GHG fluxes using Vegetation: • easily mapped and monitored in the field • monitoring by remote sensing has been tested successfully and is very promising, also in financial terms.
Monitoring by proxies Monitoring GHG fluxes using subsidence: • easily monitored by field observations, but practically impossible over large areas when annual losses are high. • In tropical peatlands (several cm y-1) the use of LiDAR looks very promising.
Monitoring of proxies • derivation of actual emissions from proxies open to improvement
conservative estimates indicate that reduced and avoided emissions from peatland rewetting and conservation can provide a major contribution to climate change mitigation