Craterstats Program for Surface Dating Analysis on Mars
Explore the Craterstats software for dating surface features on Mars by analyzing crater count data, fitting production and chronology functions, and correcting for resurfacing events. Detailed instructions and tools provided by the Planetology and Remote Sensing Institute, Freie Universität Berlin.

Craterstats Program for Surface Dating Analysis on Mars
E N D
Presentation Transcript
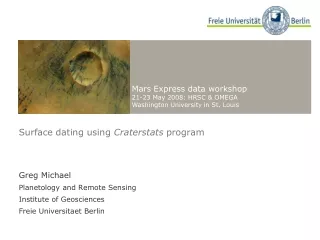
Surface dating using Craterstats program Greg Michael Planetology and Remote Sensing Institute of Geosciences Freie Universitaet Berlin
Craterstats software - dating • Production function – constant size-frequency distribution • Chronology function – changing rate (constant back to 3 Ga, then exponentially increasing) • Diameter range Mars Express HRSC/OMEGA data workshop, St. Louis, 21-23 May 2008
Craterstats software - overview • Import, bin and plot crater counts • Fit a production function • Obtain an age from a chronology function • Plot isochrons • Apply resurfacing correction • Export graphic • http://hrscview.fu-berlin.de/software.html • Detailed instructions: • http://hrscview.fu-berlin.de/craterstats.html Mars Express HRSC/OMEGA data workshop, St. Louis, 21-23 May 2008
Craterstats software – data #Model .diam file for Craterstats # Area <km^2> = 123.45 # #diameter, km 0.25 0.38 0.22 0.22 0.33 0.6 0.32 0.36 0.16 0.26 0.22 0.16 0.13 0.25 0.14 0.19 0.27 0.17 0.26 0.21 ... • area • diameters • binning (Neukum’s pseudo-log bins, Hartmann’s root-2 bins, unbinned) • error bars Mars Express HRSC/OMEGA data workshop, St. Louis, 21-23 May 2008
Craterstats software – resurfacing events • Distribution falls below PF • Simple fit in error because of excess in larger diameter range • Slope appears shallower • Find excess by fitting slope Mars Express HRSC/OMEGA data workshop, St. Louis, 21-23 May 2008
Craterstats software – resurfacing events • Distribution falls below PF • Simple fit in error because of excess in larger diameter range • Slope appears shallower • Find excess by fitting slope Mars Express HRSC/OMEGA data workshop, St. Louis, 21-23 May 2008
Craterstats software – resurfacing events • Distribution falls below PF • Simple fit in error because of excess in larger diameter range • Slope appears shallower • Find excess by fitting slope • Obtain age from chronology function in the usual way Mars Express HRSC/OMEGA data workshop, St. Louis, 21-23 May 2008
Craterstats software – sample measurement • Start • Download from: • http://hrscview.fu-berlin.de/software.html • On Windows, double-click craterstats.sav; on linux: type idl -vm=craterstats.sav • Make cumulative histogram plot • Use pre-binned count (Echus Chasma, Mary Chapman): • sample/ECHUS_CHAP_AR1_A.stat • Select the source file for the count using the ‘Browse…’ button • Set the axis ranges • Make first fit • Duplicate first plot (File-duplicate), and change plot-type to ‘fit’ • Choose production function • Select fit range • Options: age, error bars, isochron • Make 2nd fit (younger part) • Duplicate previous plot • Modify fit range • Hide plot • Make resurfacing correction • Duplicate first plot • Change colour/symbol • Modify diameter range • Enter minimum fitting diameter for correction • Check ‘resurfacing correction’ box • Make fit to corrected points • Duplicate previous plot • Change plot type to ‘fit’ • Set minimum diameter equal to the ‘minimum fitting diameter’ • Display age/isochron • Option: align left • Export graphic • Export image as .png file, or as postscript • Save composite plot (File-Save…) • Examine .plt and .txt output files (both ASCII) Mars Express HRSC/OMEGA data workshop, St. Louis, 21-23 May 2008