Download
1 / 61
610 likes | 775 Views
On the Causes of Species. Jody Hey Rutgers University. We need to understand species. We can’t understand biological diversity without understanding what species are and how they come into being Conservation We need to preserve biological diversity

E N D
On the Causes of Species Jody Hey Rutgers University
We need to understand species • We can’t understand biological diversity without understanding what species are and how they come into being • Conservation • We need to preserve biological diversity • Individual species, and species diversity, are key biomarkers • Many people’s careers, not just biologists, depend on understanding some part of biological diversity • medicine, agriculture, horticulture, tourism
Ask a series of questions • For each question, present a way of approaching the answer • While addressing three different questions, develop a statistical, population genetic approach to understanding species • The first question is fairly specific and narrow • Later questions are more general
Questions about species? • How much gene exchange goes on during speciation?
How much gene exchange goes on during speciation? • This is actually a question about natural selection: • Gene exchange can slow or stop the divergence process • If selection can pull a single species into two, without geographic separation, then it must act against gene exchange • Therefore, if divergence continues despite gene exchange, then it seems that selection is driving the divergence process
Darwin’s Principle of Divergence • Darwin thought that a single species in one large population could diverge, via the action of natural selection, into two separate species Darwin (1859)
Darwin’s Principle of Divergence • More individuals in a species can be successful if they vary in their form and lifestyle • In a large population, over a wide area, natural selection can lead to larger variations among the individuals of a species • These variations can become the basis for new species being formed, due to natural selection acting in different ways on large populations
Darwin began a long debate on the role of gene flow (and natural selection) in the divergence process • Moritz Wagner and Charles Darwin debated whether or not one species could divide into two without geographic separation • Wagner emphasized the role of gene exchange in keeping a species intact • Since Darwin the roles of geographic separation and gene exchange in speciation have been actively debated • Allopatric versus Sympatric speciation
Isolation with Migration (IM) Model for Two Populations Descendant Populations Present (Populations for Data Collection) N1 N2 m1 Gene Exchange m2 Splitting Time t NA Set of Six Parameters: Θ Ancestral Population Past
The Felsenstein Equation for the likelihood of a population genetic model, given the data Θ – parameters of the model: Splitting time, population sizes and migration rates X – genetic data G – genealogy or gene tree The Likelihood: Probability of the data given a set of parameter values Probability of the DataGiven a Genealogy Probability of a Genealogy, given the Parameters Integrate over Genealogies
Nielsen & Wakeley (2001) Applied the the Felsenstein Equation to the Isolation-with-Migration model. Developed a Bayesian approach using Markov Chain Monte Carlo (MCMC) to sample model parameters from the posterior distribution • Assume: (1) selective neutrality, (2) no recombination within loci, (3) free recombination between loci • Results are histograms (bar charts) representing a curve for each parameter in the Isolation-with-Migration model • Each curve is an estimate of the posterior probability density for one parameter
A useful alternative Nielsen & Wakeley’s MCMC method generates samples of parameter values from the posterior distribution We can construct an explicitly Bayesian form of the Felsenstein equation, that also integrates over G, that yields an analytic estimate of the joint posterior density (i.e. not just a list of parameter values) Original Felsenstein Equation: Bayesian form*: *Hey & Nielsen 2007
The Sequence of operations • Run MCMC (Markov chain Monte Carlo simulation) over G and generate random samples of G from the posterior probability: G~ P(G | X) • Build a function that is an estimate of the posterior density of Θ • This requires calculation of the prior probability for each G, P(G), and the conditional probability for G,P(G|Θ) • Because P(G|Θ) and P(G) are analytic functions, the entire expression is an analytic function that can be evaluated for any value of Θ • This function can be differentiated and searched for maxima
Extending the method to more than two populations • Assume that we know the phylogeny of the sampled populations or species • Adding more populations does not introduce new mathematical issues • The method can handle several populations, if the phylogeny is known • However the number of demographic parameters becomes quite large for multiple populations Hey (2010) Mol Biol Evol
Chimpanzees in a four population Isolation with Migration Model • Pan paniscus (Bonobo) • P. troglodytes troglodytes (Central African Chimpanzee) • P. t. schweinfurthii (East African Chimpanzee) • P. t. verus (West African Chimpanzee) • Data from 73 loci, drawn from the literature
Chimpanzee phylogeny P.t. schweinfurthii P. t. troglodytes P.t. verus P. paniscus Eastern Central West Bonobo Becquet et al., (2007) PLoS Genet 3:e66. (based on 310 microsatellite loci)
A Four Population Isolation-with-Migration Model Eastern Central Western Bonobo 7 Population sizes 3 Split times 18 Migration Rates Some Parameters extend over multiple time periods
Western Eastern Central Bonobo 8,500 27,000 8,200 7,400 32,000 7,100 Effective Population Sizes Parameter Estimates for Four Chimpanzee Populations 17,000
Western Eastern Central Bonobo 8,500 27,000 8,200 7,400 93,000 yrs 32,000 460,000 yrs 7,100 Splitting Times in years Effective Population Sizes Parameter Estimates for Four Chimpanzee Populations 930,000 yrs 17,000
Western Eastern Central Bonobo 8,500 27,000 8,200 7,400 93,000 yrs 32,000 460,000 yrs Non-zero Migration 7,100 Splitting Times in years Effective Population Sizes Parameter Estimates for Four Chimpanzee Populations 930,000 yrs 17,000
How much gene flow occurs between diverging populations? Conducted a literature survey of studies that used the IM program to study divergence Included studies of populations or species pairs that are reported to be divergent for phenotypic or ecological traits Included studies that report numerical parameter estimates for the population migration rate (2NM) Postdoc Catarina Pinho
Questions about species? • How much gene exchange goes on during speciation? • How do we sample from species if we don’t know their boundaries?
How do we sample from species if we don’t know their boundaries? • Humans are not omnipotent detectors of divergence • If some divergence has occurred but is partly hidden to investigators . . . • Then individuals might be mistakenly assigned to populations and … • Assessments of divergence may be incorrect
The Sampling Dilemma • Identify the range of a species • From patterns of variation try to identify populations • Sample individuals from each population • Study and draw conclusions about divergence
The Sampling Dilemma • Identify the range of a species • From patterns of variation try to identify populations • Sample individuals from each population • Study and draw conclusions about divergence • But… suppose the real populations are not where you think they are? • Conclusions about divergence and gene exchange will be wrong
Genetic identification of populations • Populations can be identified without phenotypes or geography using only genetic data (e.g. STRUCTURE program, Pritchard et al 2000) • Population assignments minimize departures from genetic disequilibria within loci (Hardy Weinberg) and between loci (Linkage) • Two steps to studying divergence: (1) identify populations (2) study divergence of the populations that have been identified • However two-step analyses run the risk that results might be based on incorrect assignment • Is it possible to estimate assignment simultaneously with a study of divergence?
Joint estimation of population assignment and demographic models of divergence Original expression Let the assignment of individuals to populations be a random variable: A Include A in the MCMC simulation and take samples of A from the posterior distribution A~P(A|X) Postdoc Sang Chul Choi
Example: Including Genealogy and Assignment in the Markov Chain (MCMC) Individuals, represented by gene copies: A B C D E F A B C D E F • In the Markov chain simulation: • Gene copies are connected by a genealogy • And assigned to populations 1 2 3 Isolation with Migration model for three populations
A B C D E F A B E F C D 1 2 3 1 2 3 • Later in the Markov Chain simulation: • The genealogy may be different • The population assignments of gene copies may change • The implied phylogeny may be different In this example the populations containing (C, D) and (E, F) have changed with respect to population (A, B)
Example from Common chimpanzees • P. t. troglodytes (Central African Chimpanzee) • P. t. schweinfurthii (East African Chimpanzee) • P. t. verus (West African Chimpanzee) • 10 individuals from each subspecies • Data from 9 loci (Fisher et al 2006) • Assume a three population phylogeny • Estimate Assignment and the parameters of the Isolation with Migration model
Assignment estimate True Assignment Eastern Central Western uncertainty Estimated Assignment
Phylogeny and Splitting time estimates E: Eastern C: Central W: Western E C W E C W E W C T1 T1 T1 T2 T2 T2 P(Tree|X) = 73.5% P(Tree|X) = 15.7% P(Tree|X) = 10/8%
Questions about species? • How much gene exchange goes on during speciation? • How do we sample from species if we don’t know their boundaries? • Which diverging populations do we identify as separate species?
Thinking about Divergence: from Populations to Species • One population becomes structured or divided, and divergence begins • Alleles and traits begin to become fixed • Reduced hybrid fitness may occur • Population Genetic Process • At some point the separate populations are recognizable as species • Semantic process (subjective & human) • Species continue to diverge • Phylogenetic Process
Species diagnosis for closely related forms • It is difficult to decide when to identify new species in a context of related populations • For related populations, this question arises not just for new species, but also for other taxonomic ranks • Subspecies • Informal taxa • Conservation units
Divergence magnitude varies continuously Continuously varying components of divergence: • Gene flow between related populations/species varies continuously • Population specific fixations, by genetic drift or selection, can be many or few and can occur anywhere in the genome
“…how entirely vague and arbitrary is the distinction between species and varieties.” (Darwin 1859, p. 24)
Equating the discovery of divergence with taxon diagnosis: a dilemma If divergence between populations and varieties varies continuously… Then a method that equates a finding of divergence with the identification of a new taxon… can be used to resolve as many new taxa as the investigator’s desires and resources allow
Quantitative methods that equate a finding of differentiation* with species diagnosis • genetic distance method of Good & Wake (Good & Wake 1992) • correlated distance matrixes (Puorto et al. 2001) • population aggregation analysis (PAA), (Davis & Nixon 1992) • Templeton’s tests for cohesion, (Templeton 2001) • phylogenetic/composite tree-based methods (Brooks & McLennan 1999) • cladistic haplotype aggregation (CHA) (Brower 1999) * Meaning of differentiation varies with the method
The Probability of Detecting a True Difference Increases with Sample size Probability of detection Suppose that two populations (in any context, not just species diagnosis), have a true but small difference ? Then the probability of detecting that difference is a function of the sample size
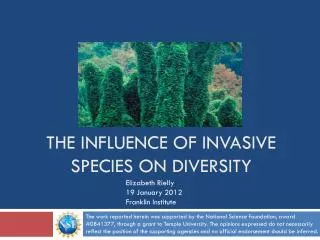
Some cases of divergence are clear to everyone, and species designations may seem objective Labeotropheustrewavasae Labeotreopheusfeulleborni Lake Malawi But within unambiguously identified taxa divergence is also common
Some cases of divergence are clear to everyone, and species designations may seem objective Labeotreopheusfeulleborni But within unambiguously identified taxa divergence is also common
Some cases of divergence are clear to everyone, and species designations may seem objective Labeotropheustrewavasae Pictures from Konings (2001) The Cichlids of Lake Malawi
How can we diagnose taxa objectively? For taxa at and below the rank of species? • If divergence varies continuously • And we wish to avoid having the rate of species diagnosis increase with sample size • We will need some sort of threshold criterion for identifying new taxa
Methods based on thresholds • Population migration rate (Nm) < 0.5 Porter (1990) • Nei’s D greater than 0.15 (Highton et al. 1989; Highton 1990). • Characters treated as fixed if they are at > 95% frequency (Wiens and Servedio, 2000) • DNA barcoding, COI divergence > 10x within species variation (Hebert et al., 2004)
Problems with threshold methods • Any threshold value will be partly arbitrary • There is no escaping this • Many species appear to be objectively distinct • But within such species we find a vast gray area in which taxon diagnosis must be arbitrary • No single threshold measure can capture the complexities of the divergence process