Download
1 / 21
210 likes | 398 Views
TPC Detector Response Simulation and Track Reconstruction. Physics goals at the Linear Collider drive the detector performance goals: charged particle track reconstruction resolution: d (1/p)= ~ 4 x 10 -5 /GeV

E N D
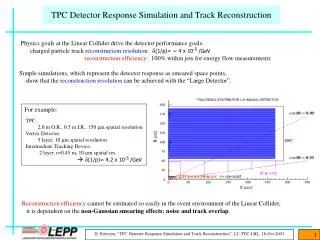
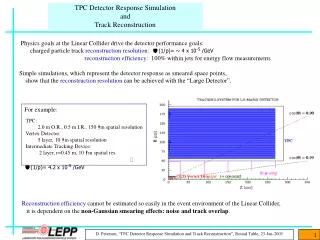
TPC Detector Response Simulation and Track Reconstruction Physics goals at the Linear Collider drive the detector performance goals: charged particle track reconstruction resolution: d(1/p)= ~ 4 x 10⁻⁵ /GeV reconstruction efficiency: 100% within jets for energy flow measurements Simple simulations, which represent the detector response as smeared space points, show that the track reconstruction resolution can be achieved with the “Large Detector”. • For example: • TPC: • 2.0 m O.R., 0.5 m I.R., 150 mm spatial resolution • Vertex Detector: • 5 layer, 10 mm spatial resolution • Intermediate Tracking Device: • 2 layer, r=0.45 m, 10 mm spatial res. • d(1/p)= 4.2 x 10⁻⁵ /GeV Reconstruction efficiency cannot be easily estimated in the event environment of the Linear Collider, it is dependent on the non-Gaussian smearing effects: noise and track overlap. D. Peterson, “TPC Detector Response Simulation and Track Reconstruction”, SLAC, 07-Jan-2004
Reconstruction Efficiency While reconstruction efficiency is difficult to estimate, one could achieve the maximum efficiency using the maximum segmentation possible with a GEM or MicroMegas amplification TPC. However, the channel count would be excessive (and expensive); [ 0.1 cm2 pads ] 2.4 x 10⁶ multi-hit channels . To optimize the detector design, measure the reconstruction efficiency with respect to the detector segmentation, determine the minimum segmentation that provides the “full” efficiency. A TPC design would be simpler if I can convince you that 0.4 cm2 pads would be sufficient. The goal of this work is to measure the reconstruction efficiencyand thereby optimize the design for a TPC in the “Large Detector” design, incorporating as many real detector effects as possible ( pad size, charge spreading, inefficient pads, noise ), for complicated physics events simulating Linear Collider processes, and using pattern recognition that starts with pad level information ( not space points) . Many thanks to Mike Ronan for wrapping the Cornell reconstruction code in Java and providing a access to lcd simulation events in .sio format. D. Peterson, “TPC Detector Response Simulation and Track Reconstruction”, SLAC, 07-Jan-2004
Illustration of information provided by the MC: Sample event Sample event from lcd simulation (All hits are are projected onto one endplate.) 143 layers from 56cm to 200 cm 2 mm wide pads, 1cm radial “height” (number of pads in layer is multiple of 8) charge spread is minimal no noise This would be similar to a situation with 1 mm pads and charge spreading to 2 pads, a very expensive detector. D. Peterson, “TPC Detector Response Simulation and Track Reconstruction”, SLAC, 07-Jan-2004
Sample Event: Tracks within a Jet (Same event, same pad response ) Tracks in a jet are usually separated. It appears that, when taking advantage of the z separation, the reconstruction task would be simple. Active cone: Z=[ r * (-6 / 80) ] +/- 4.7 cm D. Peterson, “TPC Detector Response Simulation and Track Reconstruction”, SLAC, 07-Jan-2004
Sample Event: Problem with Overlapping Tracks (Same event, same pad response ) However, z separation is often too small to provide track separation. crossing tracks in r-f, and z-separation = 1 mm . But, track reconstruction can be efficient for very close tracks by using information from regions where the tracks are isolated. This is an advantage of the pat. rec. to be described. Active cone: Z=[ r * (-6 / 80) ] +/- 4.7 cm D. Peterson, “TPC Detector Response Simulation and Track Reconstruction”, SLAC, 07-Jan-2004
Detector Simulation: Pad Response ( and Clustering ) The lcd simulation provides only crossing points; extensions to the simulation are created within the CLEO library. Charge spreading on the pads Gaussian width, cut-off (~ .002 of min.ion.), maximum total-number-pads charge is renormalized to provide a total of min. ion. Wave Form to simulate time (=z) response Clustering in r-f criteria for minimum central pad , added adjacent pads splitting at a local minimum, can lead to pulse height merging and incorrect clustering. Pads with > 0.51 of the maximum are treated as “core pads”. (a detail of the primary pattern recognition) D. Peterson, “TPC Detector Response Simulation and Track Reconstruction”, SLAC, 07-Jan-2004
New: Ionization distribution at large entrance angle Cell width: 4mm Ionization is spread across the cells. Previously, ionization was created only where the track crossed the central radius. Also shown: multi-hits clustering Active cone: Z=[ r * (-3 / 80) ] +/- 4.7 cm D. Peterson, “TPC Detector Response Simulation and Track Reconstruction”, SLAC, 07-Jan-2004
Track Reconstruction With a goal of accurately measuring the TPC pad size and spreading that will provide the “full” reconstruction efficiency in Linear Collider physics events, it becomes important to know what is being measured, inherent reconstruction efficiency, limited by the track overlap and hit distortion, and NOT an efficiency that is limited by the algorithm. Require a means to independently determine the root cause of reconstruction failures. The CLEO reconstruction program include a diagnostics package that provides internal hit information and a graphics interface to the hit assignment, at intermediate stages in the programs. This allows rapid determination the root cause of reconstruction failures (on single tracks) and algorithm development. D. Peterson, “TPC Detector Response Simulation and Track Reconstruction”, SLAC, 07-Jan-2004
CLEO Track Reconstruction The current CLEO charge particle track reconstruction originally written for a drift chamber (where z information is derived from the track and stereo layers), can be adapted to any type of device with dense hit information (like a TPC, but not silicon) by changing the details of how Z information is derived from the detector signals, is highly efficient for overlapped tracks (as shown in the event ) because any region of track separation can be used as a seed, has 3 stages: 1. clean segment finding 2. initial track finding within the segment road 3. extension to more complicated regions (and other devices). Segments are found in pre-selected, I.P. pointing, cones. D. Peterson, “TPC Detector Response Simulation and Track Reconstruction”, SLAC, 07-Jan-2004
Projected hits for event, after detector response simulation Same event as slide3 5 mm pads, 3.5 mm charge spread Noise: 0.003 occupancy in 3-d volume 1 cm (r-f) x 2 cm (z) x layer Number of channels (1 side) 222 k Number of layer crossings 14946 Number of track hits = 137019 (each crossing creating ~ 9.2 hits) Number of noise hits = 89385 Active hits in green Ignored hits in purple Active cone: Z=[ r * (-7 / 80) ] +/- 4.7 cm D. Peterson, “TPC Detector Response Simulation and Track Reconstruction”, SLAC, 07-Jan-2004
Segment Finding Stage Active hits in green Ignored hits in purple Current isolated segment is shown in yellow Other isolated segments are shown in pink. At this point, processing for segments is not complete; not all segment are found. The segment has been extended into the overlap region. Segments are interrupted in regions of track overlap. D. Peterson, “TPC Detector Response Simulation and Track Reconstruction”, SLAC, 07-Jan-2004
After 2nd Phase, r-f view Hits in road in orange. Hits on track in white . 5 mm pads Track does not extend into track overlap region. r-f impact = 280 mm c2 (of the fit to a track) = 2 with declared hit resolution: 100 mm This implies that the hit resolution is too good; hit resolution = 141 mm for 5 mm pads, Smearing of the pulse heights is incomplete; requires low-level electronic noise. D. Peterson, “TPC Detector Response Simulation and Track Reconstruction”, SLAC, 07-Jan-2004
After 2nd Phase, residual (r-f) view PLOT: residual on horizontal (+/- 0.025 cm at edge) vs. radius on vertical 2nd phase pattern recognition uses local residual correlations ( radius is broken up into 16 parts ) In each radial part, look for correlated hits satisfying used r-f road < 0.005 m used z road < 0.10 m . As will be discussed later, there is only a weak requirement on the agreement of the average z-coordinate of the solutions in each radial part. Then, select best solution in each radial part. No solutions were found at low radius. Note: other track. D. Peterson, “TPC Detector Response Simulation and Track Reconstruction”, SLAC, 07-Jan-2004
After 2nd Phase, z view Hits in road in orange. Hits on track in white . PLOT: Z on vertical (+/- 2.5 meter ) vs. path length on horizontal The other track is also very close in Z. Below .7 meter in arc length, the hits are merged and not usable, for either track. Note: - other track (interference) - short tracks that escape the r-f road, - curler, not completely in the r-f road D. Peterson, “TPC Detector Response Simulation and Track Reconstruction”, SLAC, 07-Jan-2004
MC tracks selected for efficiency studies MC generated track list (not used) 1) curv1, f1, impact1, Z01, COS(q)1 2) curv2, f2, impact2, Z02, COS(q)2 3) curv3, f3, impact3, Z03, COS(q)3 … … N) curvN, fN, impactN, Z0N, COS(q)N MC generated hit list 1) gen. track1, layer1, X1, Y1, Z1 2) gen. track2, layer2, X2, Y2, Z2 3) gen. track3, layer3, X3, Y3, Z3 … i) gen. tracki, layeri, Xi, Yi, Zi … j) gen. trackj, layerj, Xj, Yj, Zj … M) gen. trackM, layerM, XM, YM, ZM Sub-list of contiguous generated hits satisfying… a) same generated track number b) starts at layer 1 c) increasing layer number d) truncated if layer number decreases (top of curler) e) continues through at least 30 layers “Plausible Track” List 1) curv1, f1, COT(q) 1, impact1, Z01 … n) curvn, fn, COT(q) n, impactn, Z0n TRACK FIT Match c2 = (DC/.002)2+(Df/.003)2+(DCOT/.002)2 D. Peterson, “TPC Detector Response Simulation and Track Reconstruction”, SLAC, 07-Jan-2004
Preliminary “results” Track finding efficiency dependence on pad width. Require c < 25 (defined on previous slide.) Efficiency for straight tracks plateaus at ~ 4mm pad width, at ~ 97%. (Discussion follows.) ( Recall: Noise: 0.003 occupancy in 3-d volume 1 cm (r-f) x 2 cm (z) x layer ) Efficiency for curling tracks is worse. And, the efficiency is worse at the smallest pad width which can only be the fault of the pattern recognition. (Discussion follows.) D. Peterson, “TPC Detector Response Simulation and Track Reconstruction”, SLAC, 07-Jan-2004
Preliminary “results”, discussion Efficiency for straight tracks plateaus at ~ 4 mm cell width (for this noise level). Efficiency at plateau: ~ 97% . Reason: track search does not extend beyond COT(q)>2. (from slide 16) D. Peterson, “TPC Detector Response Simulation and Track Reconstruction”, SLAC, 07-Jan-2004
Preliminary “results”, discussion Efficiency for curling tracks extrapolates to ~ 80%. Anomalous behavior: efficiency decreases for cell size < 4mm. Curling tracks require more refinement, although improved since Berkeley. Separate treatment for straight and curling tracks may be required. This will be addressed in the near future. (from slide 16) D. Peterson, “TPC Detector Response Simulation and Track Reconstruction”, SLAC, 07-Jan-2004
Can the plateau be pushed to 6mm cell width ? Compare track lists from 2mm and 6mm cell size. Identify 17 tracks lost with 6mm cell, out of the 763 tracks found with 2mm cell. Identify 2 pathologies. 1) large overlap within selection cone. An isolated segment is found, but the ability to start with any isolated segment and extend is not yet implemented. Basically, I am using the online version. D. Peterson, “TPC Detector Response Simulation and Track Reconstruction”, SLAC, 07-Jan-2004
Can the plateau be pushed to 6mm cell width ? Top: 6 mm cell Bottom: 2 mm cell 2) overlap at small radius, Earlier described that the “best” solution, within a radial group, is selected. Inconsistency of the Z solutions is observed, but the consistency requirement is not implemented. D. Peterson, “TPC Detector Response Simulation and Track Reconstruction”, SLAC, 07-Jan-2004
Outlook “Complete” at the SLAC 2004 ALCPG meeting: interface to the LCD physics simulation through .sio file (Mike Ronan) create a TPC geometry, data structure, and detector response simulation within the Cornell/CLEO reconstruction create the TPC specific x,y,z hit reconstruction routines upgrade the reconstruction to handle multi-hit electronics procedure for scanning through the I.P. pointing cones and sorting tracks develop a method for identifying tracks that should be found some optimization of the 1st level pattern recognition for TPC readout identification of pathologies limiting the efficiency at 6 mm pad width Needed for efficiency studies: higher statistics would like to have events with a specific 2 body process, e.g. Z mm. for resolution: apply low level noise to all pulse heights, fraction of min.ion. implement the full 2nd level pattern recognition to solve inconsistent z solutions and resolve overlapping tracks implement the 3rd level pattern recognition to extend overlapping tracks Result: efficiency vs pad size: efficiency nearly plateaus at 4mm pad size Future results:efficiency and resolution vs. pad size charge spread , noise level, and 2-track separation, P, and q D. Peterson, “TPC Detector Response Simulation and Track Reconstruction”, SLAC, 07-Jan-2004