Download
1 / 41
410 likes | 899 Views
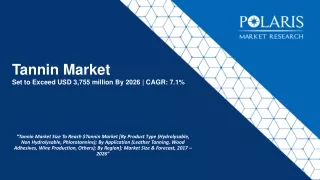
Phenolics and Tannin Assays for Practical Use in Winemaking Giovanni Colantuoni John Thorngate. Outline. Introduction Grape and Wine Phenolics Measuring Phenolics Adams-Harbertson Assays Gage R&R Analysis Creating a Standardized SOP The UV-Vis Predictive Model

E N D
Phenolics and Tannin Assays for Practical Use in Winemaking Giovanni Colantuoni John Thorngate
Outline • Introduction • Grape and Wine Phenolics • Measuring Phenolics Adams-Harbertson Assays • Gage R&R Analysis • Creating a Standardized SOP • The UV-Vis Predictive Model • Chemometrics — Model Calibration and Deployment • Comparison to Skogerson-Downey-Boulton • Using the Model • Summary
Chemists interested in polyphenols, in common with the majority of scientists, tackle today’s problems with yesterday’s tools, i.e., current problems are attacked with methods which are inadequate and to that extent are already out of date. The discovery and quick application of new methods or developments and extensions of existing methods is therefore of first importance. B.R.Brown, In Methods of Polyphenol Chemistry, 1964
Introduction • Why focus on phenolics? • Important for: • Color • Taste • Mouthfeel • Wine aging
Introduction • Why measure phenolics? • Identify higher quality lots more easily • Use phenolic data for: • Press decisions • Heavy press additions • Blend balancing • Evaluation of processing
Grape and Wine Phenolics • Phenolic compounds of interest to the winemaker: • Phenolic acids • Flavonoids • Anthocyanins • Tannins • Polymeric Pigment J.A. Kennedy, Grape and wine phenolics: Observations and recent findings, Ciencia e Investigación Agraria35:77-90, 2008
Phenolic Acids Kennedy, 2008
Flavonoids Quercetin A.L. Waterhouse, Wine Phenolics, Annals of the New York Academy of Sciences 957:21-36, 2002
Anthocyanins Kennedy, 2008
Tannins Schofield et al., Analysis of Condensed Tannins: A Review Animal Feed Science and Technology91:21-40, 2001
Polymeric Pigments Kennedy, 2008
Phenolic Levels in Wine Waterhouse, 2002
Measuring Phenolics • Total Phenolics • A280 • Folin-Ciocalteu • Tannins • Acid Butanolysis • Aldehyde • Pigments Nota bene: unless you are chromatographically separating discrete compounds all measures of phenolics are methodologically defined
Total Phenolics • Absorbance at 280 nm • Pro’s: Simple; just requires UV-transparent cuvette and a UV-capable spectrophotometer (express as A280 in AU) • Con’s: Subject to interferences from other aromatic ring containing compounds (e.g., nucleotides, aromatic amino acids) • Nota bene. . .these are relatively small effects
Total Phenolics • Folin-Ciocalteu • Pro’s: Measures all mono- and dihydroxylated phenolics; automatable • Con’s: Subject to interferences from fructose and SO2; spent reagent has to be disposed of as hazardous waste
Tannins • Acid Butanolysis • Pro’s: Specific for tannins; anthocyanidin color measured with spectrophotometer (relative abundance) • Con’s: Low reaction yields; highly dependent upon reaction conditions and the tannin structure
Tannins • Aldehydes (Vanillin, DMCA*) • Pro’s: Measures flavan-3-ols and polymers (m-dihydroxy’s); color measured with spectrophotometer • Con’s: Rate and extent of color development solvent dependent; vanillin adduct absorbs at 500 nm (problematic for red wines) *dimethylaminocinnamaldehyde
Pigments • Any number of spectrophotometric assays for pigments are available • These procedures have been extensively researched by Chris Somers in Australia (e.g.,The Wine Spectrum, Winetitles: Marleston, SA, 1998) • e.g., A520, A420 and all their permutations
Adams-Harbertson Assays • Functional assays providing quantitative information on various phenolic classes • Total iron-reactive phenols • Analogous to Folin-Ciocalteu • Caveat: doesn’t measure monohydroxylated phenols or anthocyanins • Protein (BSA) precipitable tannins • Tetrameric tannins and larger • Polymeric pigments • Non-SO2 bleachable pigmented fractions • Non-protein precipitable: small polymeric pigment • Protein precipitable: large polymeric pigment • Free Anthocyanins
Adams-Harbertson Assays • Benefits • Can run the analyses in-house IF you have a Visible spectrophotometer, a microcentrifuge, a vortexer and the necessary micropipettes • The IRP is a measure of total phenolics (minus anthocyanins) and doesn’t generate hazardous waste • The protein-precipitable tannin is highly correlated to perceptual astringency
Tannin vs. Astringency Kennedy et al., Analysis of Tannins in Red Wine Using Multiple Methods: Correlation with Perceived Astringency, AJEV57:481-485, 2006
Running the A-H Assay • Sets of up to 24 samples • 4/5 segments, 9 sets of readings, ~ 3 hours • 5 results: anthocyanins, tannins, IRP, SPP, LPP
Gage R & R • OBJECTIVE: Quantify Measurement Error in Measurement Systems • Integral Part of SIX SIGMA Methodology • Quality Systems… Zero Defects… ISO Standards… • Goal: less than 3.4 defects in a million opportunities • Early adapters: Motorola & Allied Signal (early 90’s) • General Electric Co. – most successful implementer • Two components • Standard Deviation of Measured Values • Assessment of Source of Variability • Contributors to Measurement Variation • Repeatability – Single Operator, Same Equipment • Reproducibility – Operators, Protocol, Equipment,…
Gage R & R • Study Conducted in April-June 2008 • Design of Experiments - DOE • 3 wineries, 5 wines, 4 technicians, 4 repetitions • full-factorial, randomized – 80 test results • Resulting Standard Deviations • (free-) Anthocyanins 3.02% • SPP 2.01% • LPP 4.86% • Tannins 2.79% • IRP 3.78% • But… observed spikes of 7.6, 11.7,… 27.5% • ANOVA analysis needed – Used MINITAB
Gage R & R • Operator Contribution 3.3 %, # of Categories* 7 * Automotive Industry Action Group (AIAG) Measurement Systems Analysis (June 1998)
Gage R & R • Operator Contribution 34.4 %, # of Categories* 1 * Automotive Industry Action Group (AIAG) Measurement Systems Analysis (June 1998)
Standard Procedure • The Assay Protocol – Essential KEY to Repeatability & Reproducibility • Sources of Adams-Harbertson Assay Protocol • Technical literature and journals • UC Davis Department of Viticulture & Enology website • Trade publications • Individual laboratory adaptations • In practice… a multitude of ways of running the Assay • Consequently, • Large variations in reported results • And even declarations of intrinsic invalidity • Moreover, • A closer look at the assay reveals significant potential for improving its repeatability and reducing time of execution
Standard Procedure • Road to the Adams-Harbertson Assay SOP • Initial documented procedure in place at Rubicon Estate • Set up with the assistance of Dr. Harbertson & Dr. Adams • Base documents from UC Davis Department of V & E website • Modifications introduced and validated over time • Salient results shared with Dr. Adams • Jointly with Dr. Thorngate determined need for SOP • Now working with the Gold Standard Group • Created draft for the “Modified A&H Assay SOP” • Currently being cast in ISO format • Review and finalization to follow • Gage R&R planned for mid-year 2010 • Expected SOP release date – Fall 2010 • Preliminary results indicate reduction in error “spikes”, increased repeatability, and over 1/3 reduction in runtime
UV-Vis Spectroscopy • Early in Primary Fermentation
UV-Vis Spectroscopy • Later in Primary Fermentation
Calibration / Modeling Calibration / Modeling • Linear Curve-fitting A&H Assay Results – Predicted UV-Vis Spectrum MODEL * * * anthocyanins * * * absorbance @ 520 nm
UV-Vis Based A-H Assay • Multivariate Modeling - Chemometrics • Openly-available, widely-used technology • Commercial software packages can be purchased • Implemented (and in use) in other process industries • Applications: lab, virtual sensors, process optimization • Expected Impact • Implemented locally in the winery laboratory • Once in place, no phenolics wet chemistry analyses • Essentially no sample preparation • Assay time of one-to-two minutes per sample • Ideal for real-time vinification decisions
UV-Vis Based A-H Assay • Development Methodology laboratory analytical instrumentation (lab-based; HPLC, GC/MS, …) MEASURED VALUES MRSEC standardized measurements CALIBRATION SAMPLES (training and testing) process analytical instrumentation (at-line or in-line; UV/Vis, IR, …) model building & deployment (multivariate; PCR, PLS, ANN,… ) SAMPLE RESULTS SPECTRA PC / Notebook
UV-Vis Based A-H Assay • Validation laboratory analytical instrumentation (lab-based; HPLC, GC/MS, …) MEASURED VALUES MRSEV or MRSEP standardized measurements FIELD VALIDATION SAMPLES process analytical instrumentation (at-line or in-line; UV/Vis, IR, …) model building & deployment (multivariate; PCR, PLS, ANN,… ) SAMPLE RESULTS SPECTRA PC / Notebook TEST SAMPLES
UV-Vis Based A-H Assay • Deployment process analytical instrumentation (at-line or in-line; UV/Vis, IR, …) model building & deployment (multivariate; PCR, PLS, ANN,… ) SAMPLE RESULTS SPECTRA PC / Notebook TEST SAMPLES
Model Comparisons NOTE: Skogerson data was for Australian wines; Current data was for domestic wines. amg/L malvidin-3-glucoside equivalents bmg/L catechin equivalents
That being said. . . There is ample room for improvement! RMSEP: root mean square error of prediction rpred2: coefficient of determination of the prediction RPD: ratio of standard deviation to standard error of prediction CVpred: coefficient of variation of the prediction amg/L malvidin-3-glucoside equivalents bmg/L catechin equivalents
Summary • The Adams-Harbertson assays measure functional classes of phenolic compounds in wine • The Adams-Harbertson assays are repeatable and reproducible • The Adams-Harbertson assays SOP — a work in progress • The Predictive Model shows great promise — additional work is required
Acknowledgments • Dr. James Harbertson (Assoc. Prof.!) and his laboratory • Dr. Douglas Adams • Gold Standard • Jordan Ferrier • Dr. Roger Boulton, Dr. Mark Downey & Kirsten Skogerson • Tondi Bolkan, Evan Schiff, Karen Moneymaker