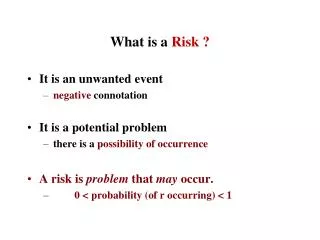
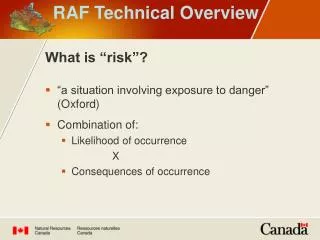
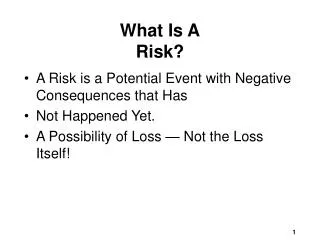
WHAT IS RISK?
WHAT IS RISK?. “The Variability of Returns from those that are expected”. Total Risk = Systematic Risk + Unsystematic Risk.

WHAT IS RISK?
E N D
Presentation Transcript
WHAT IS RISK? “The Variability of Returns from those that are expected”
Total Risk = Systematic Risk + Unsystematic Risk • Systematic Risk is the variability of return on stocks or portfolios associated with changes in return on the market as a whole. It is also called market or non-diversifiable risk. • Unsystematic Riskis the variability of return on stocks or portfolios not explained by general market movements. It is avoidable through diversification. It is also called firm-specific or diversifiable.
Total Risk = Systematic Risk + Unsystematic Risk UR = Factors involve lawsuit, strikes, successful and unsuccessful marking programs, The winning and losing of major contracts. STD DEV OF PORTFOLIO Unsystematic risk Total Risk Systematic risk NUMBER OF SECURITIES IN THE PORTFOLIO
Stand-Alone Risk: • The risk associated with a single investment when it is held by itself, or in isolation, not in combination with other assets.
Measuring Risk With The Help Of Standard Deviation If only sample returns data over some past periods are available, than Estimated here denotes the past realized rate of return in period t, and Is the average annual return earned during the last n years.
Measuring Stand-Alone RiskThe Standard Deviation Variance = =3,517.0 Standard Deviation = = MCB=59.3% Variance = OGDC=3.6%
Coefficient of Variation Another useful measure to evaluate risky investments is the coefficient of variation (CV). Coefficient of variation = CV = = WATEEN OGDC CV = CV = =3.95 =0.24
Diversification • Definition - An investment strategy designed to reduce risk by spreading the funds invested across many securities. • Since people hold diversified portfolios of securities, they are not very concerned about the risk and return of a single security. They are more concerned about the risk and return of their entire portfolio.
Portfolio Risk • The risk associated with an investment when it is held in combination with other assets, not by itself.
Example: Portfolio Variance • Assume the following Statistics for stock A and B. • What is the expected return and variance of this two-security portfolio?
Example: Portfolio Variance (cont’d) • Solution: The expected return of this two security portfolio = 0.018
Example: Portfolio Variance (cont’d) • The variance of this two security portfolio is:
CORRELATION • The Correlation Coefficient between the returns on two stocks can be calculated as follows: Where: • rA,B=the correlation coefficient between the returns on stocks A and B • sA,B=the covariance between the returns on stocks A and B, • sA=the standard deviation on stock A, and • sB=the standard deviation on stock B
RETURN: • The percentage change in value of the investment over a given period of time.
Expected Return The rate of return expected to be realized from an investment; the mean value of the probability distribution of possible results. Or The return that an investors expects to earn on an asset, given its prices, growth potential.
Probability Distribution • A listing of all possible outcomes, or events, with a Probability (chance of occurrence) assigned to each outcome.
Expected Return Expected rate of return = Here is the possible outcome, is the probability the outcome will occur, and n is the number of possible outcomes. Thus is a weighted average of the possible outcomes.
Expected Return State of Probability Return Economy (P) MCB KASB BANK OPTIMISTIC .20 110% 20% NORMAL .50 22% 16 PESSIMISTIC .30 -60% 10% For MCB, the expected return on the stock is:
Portfolio Returns The weighted average expected return on the stocks held in the portfolio. Here are the expected returns on the individual stocks, the are weights, and there are N stocks in the portfolio.
Correlation Coefficient • The “Correlation Coefficient” is a measure of the extent that two variables move or vary together. • It ranges between –1.0 and +1.0 • Positive correlation: a high value on one variable is likely to be associated with a high value on the other. • Negative correlation: a high value on one variable is likely to be associated with a low value on the other. • No correlation: values of each are independent of the other
Correlation Coefficient: • Rate of Return Distribution for two perfectly negatively correlated stocks (r = -1.0)
Stock M Portfolio WM Stock W 25 15 0 0 0 -10 -10 Correlation Coefficient: • Rate of Return Distribution for two perfectly negatively correlated stocks (r = -1.0) • a. Rates of Return 25 25 15 15 2000 2000 2000 -10
Correlation Coefficient: • Rate of Return Distribution for two perfectly positively correlated stocks (r = 1.0)
Stock M’ Portfolio MM’ Stock M 25 25 25 15 15 15 0 0 0 -10 -10 -10 Correlation Coefficient: • Rate of Return Distribution for two perfectly positively correlated stocks (r = 1.0) • a. Rates of Return 2000 2000 2000
Relationship b/w Risk & Return • The Risk-Return relationship is characterized as being a "positive" or "direct" relationship . • Greater degrees of risk must be compensated for with greater returns on investment. • If an investment has relatively lower levels of expected risk then investors are satisfied with relatively lower return.
Investors Attitude towards Risk • Investors are assumed to be risk averse • Risk Aversion: Assumes investors dislike risk and require higher rates of return to encourage them to hold riskier securities. • Risk Premium: It is the difference between the expected rate of return on a given risky asset and that on a less risky asset
Capital Asset Pricing Model CAPM is a model that describes the relationship between risk and expected (required) return; in this model, a security’s expected (required) return is the risk-free rateplus a premium based on the systematic risk of the security.
Required rate of return =
Risk-free rate of return Required rate of return = +
Risk-free rate of return Required rate of return Risk Premium = +
Risk-free rate of return Required rate of return Risk Premium = + Market Risk
Risk-free rate of return Required rate of return Risk Premium = + Market Risk Firm-specific Risk
Risk-free rate of return Required rate of return Risk Premium Market Risk Firm-specific Risk can be diversified away = +
Risk and the CAPM: The uses of the capital asset pricing model (CAPM) include: • Trying to establish the ‘correct’ equilibrium market value of a company’s shares. • Trying to establish the cost of a company’s equity, taking account of the risk characteristics of a company’s investment, both business and financial risk.
CAPM FORMULA : Where is the expected return from an individual security is the risk- free rate of return is the expected return from the market as a whole is the beta factor of the individual security or project is the market premium for risk
The Concept of Beta: • Beta () measures a stock’s market (or systematic) risk. It shows the relative volatility of a given stock compared to the average stock. An average stock (or the market portfolio) has a beta = 1.0. • Beta shows how risky a stock is if the stock is held in a well-diversified portfolio.
How are betas calculated? • The beta factor for a particular security can be calculated by plotting its return against the market return and drawing the line of best fit. • The equation of this line can be derived by regression analysis.
BETA. Beta: a measure of market risk. Specifically, it is a measure of how an individual stock’s returns vary with market returns. It’s a measure of the “sensitivity” of an individual stock’s returns to changes in the market.
The market’s beta is 1 • A firm that has a beta = 1 has average market risk. The stock is no more or less volatile than the market. • A firm with a beta > 1 is more volatile than the market (ex: computer firms). • A firm with a beta < 1 is less volatile than the market (ex: utilities).
Calculating Beta 15 10 5 -15 -10 5 15 -5 10 -5 -10 -15 XYZ Co. returns S&P 500 returns
Calculating Beta 15 10 5 -15 -10 5 15 -5 10 -5 -10 -15 XYZ Co. returns . . . . . . . . . . . . . . . . . . . . . . . S&P 500 returns . . . . . . . . . . . . . . . . . . . .
Calculating Beta 15 10 5 -15 -10 5 15 -5 10 -5 -10 -15 Beta = slope = 1.20 XYZ Co. returns . . . . . . . . . . . . . . . . . . . . . . . S&P 500 returns . . . . . . . . . . . . . . . . . . . .
Portfolio Beta Coefficients: • Portfolio betas are equal to the weighed sum of individual security betas. Here is the beta of the portfolio, and it reflects how volatile the portfolio is in relation to the market; is the fraction of the portfolio invested in the stock; and is the beta coefficient of the stock.
The equation for CAPM:The Security Market Line (SML): • The line that shows the relationship between risk as measured by beta and the required rate of return for individuals securities. = 6%+(14-6%)(0.5) =6%+8%(0.5) =10%