Download
1 / 16
160 likes | 311 Views
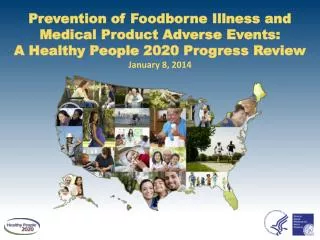
Healthy People 2010 Focus Area 17: Medical Product Safety Progress Review October 19, 2007. Adverse Medical Events. Definition Injuries due to medical management (rather than the disease process). Causes Drugs/medications Properly administered Overdose/misadministered

E N D
Healthy People 2010 Focus Area 17:Medical Product SafetyProgress ReviewOctober 19, 2007
Adverse Medical Events • Definition • Injuries due to medical management • (rather than the disease process). • Causes • Drugs/medications • Properly administered • Overdose/misadministered • Medical/surgical complications • Diagnostic/procedural errors • Medical devices • Proper use • Malfunctions
Overview • Adverse Medical Events • $58,766 per event • $113,280 per event involving negligence • 10.9 million ambulatory care visits • Including 1.8 million (4.4%) ER visits • Adverse Drug Events (ADEs) • At least 1.5 million preventable ADEs in the US • annually • In hospital ADEs • At least $3.5 billion in total annual cost • Additional $8,750 per stay
No trend data Target met or exceeded Improving Little or no change * Medical Product Safety Objectives Monitoring and Analyzing Events 17-1a Monitoring and analyzing adverse events associated with medical therapies Electronic Medical Record (EMR) and Computerized Prescriber Order Entry (CPOE) Use 17-2a EMR use by health care providers in health care organizations 17-2b EMR use by pharmacists in managed care and integrated health systems 17-2c CPOE use by general and children’s hospitals 17-2d CPOE use by urban acute care facilities Consumer Receipt of Information 17-4 Receipt of useful information about prescriptions from pharmacies 17-5a, b Receipt of oral counseling about medications from prescribers & pharmacists Blood Donation 17-6 Blood donations * Percent of targeted change achieved is between -10% and 10%.
ED Visits for Adverse Effects of Medical Treatment for Adults 65 Years and Over Visits per 1,000 population All adverse effects Medical/surgical complications Drugs 1992 1993-4 1995-6 1997-8 1999-00 2001-2 2003-4 2005 Note: ED is defined as an Emergency Department. SOURCE: National Ambulatory Medical Care Survey; National Hospital Ambulatory Medical Care Survey, CDC, NCHS.
Adverse Drug-Related Events by Patient Age, 2004 Patient Age Distribution 0-17 yrs 18-44 yrs 45-64 yrs 65+ yrs 17% 27% 22% 34% 65+ yrs 0-17 yrs 18-44 yrs 45-64 yrs Percent of patients Accidental Overdose/Misadministration Adverse Effects Note: Adverse Effects are unexpected or negative effects of drugs properly administered in therapeutic or prophylactic dosage. Accidental Overdose/Misadministration refer to the wrong drugs being given or taken in error, or drugs taken inadvertently. SOURCE: AHRQ, Center for Delivery, Organization, and Markets, Healthcare Cost and Utilization Project, Nationwide Inpatient Sample, 2004.
General and Children’s Hospitals that Monitor Adverse Drug Events Increase desired 2010 Target: 90 Percent of hospitals 1998 2001 2003 SOURCE: National Survey of Pharmacy Practice in Acute Care Settings, American Society of Health System Pharmacists (ASHP). Obj. 17-1a
Percent of providers Electronic Medical Record Use by Providers in Health Care Organizations Increase desired 2010 Target: 18 40 30 20 10 0 2000 2001 2002 2003 2004 2005 2006 2007 Note: Health care organizations include stand-alone and multi-system hospitals, physician offices, mental/behavioral health facilities, long-term care facilities, and home-health agencies. SOURCE: Annual HIMSS Leadership Survey, Healthcare Information and Management Systems Society. Obj. 17-2a
Percent of hospitals Computerized Prescriber Order Entry Use by General and Children’s Hospitals Increase desired 2010 Target: 6 * Note: * Data are not available for 2002. In 2004, in response to the crash, failure and subsequent placement on hold of one large hospital’s group CPOE system, several other hospitals and hospital groups followed suit and placed their implementation on hold. SOURCE: National Survey of Pharmacy Practice in Hospital Settings, American Society of Health System Pharmacists (ASHP). Obj. 17-2c
2006 2001 Percent of hospitals Computerized Prescriber Order Entry System Use by Size (General and Children’s Hospitals) Total <50 50-99 100-199 200-299 300-399 400+ Number of Staffed Beds SOURCE: National Survey of Pharmacy Practice in Hospital Settings, American Society of Health System Pharmacists (ASHP).
Percent of facilities Computerized Prescriber Order Entry Use by Urban Acute Care Facilities Increase desired 2010 Target: 7 2003 2004 2005 2006 Note: An urban acute care facility is defined as a short-term Medicare certified hospital. SOURCE: The Leapfrog Group Hospital Patient Safety Survey, The Leapfrog Group for Patient Safety. Obj. 17-2d
Percent of patients Patient Receipt of Verbal Counseling about Medications Increase desired 2010 Target: 95 Prescribers Pharmacists 2004 2000 1998 100 90 80 70 60 50 40 30 20 10 0 Note: Estimates reflect patient receipt of information on how much and how often to take medication, precautions andside effects. SOURCE: National Survey of Prescription Medicine Information Received by Consumers, FDA Obj. 17-4, 5a & 5b Obj. 17-5a & 5b
Blood Donations, 2006 Increase desired = 95% confidence interval. Note: Data are for adults aged 18 years and over who have donated blood in the past 12 months. * Not age-adjusted. The categories black and white exclude persons of Hispanic origin. Persons of Hispanic origin may be any race. Respondents were asked to select one or more races. Data for the single race categories are for persons who reported only one racial group. SOURCE: National Health Interview Survey (NHIS), CDC, NCHS. Obj. 17-6 Total Hispanic Black Asian White 18-24 yrs* 25-44 yrs* 45-64 yrs* 65+ yrs* Female Male Persons w/Disability Persons w/o Disability 2010 Target: 8 0 5 10 15 Percent (age adjusted)
Blood Supply Adequacy 15 14 13 12 11 10 0 1992 1999 1989 1997 2004 1994 2001 Millions of units Collections Available Collections Transfusions Note: Represents allogeneic collections. Available collections are composed of those units that have passed all laboratory tests and are available for transfusion. SOURCE: 2005 Nationwide Blood Collection and Utilization Survey Report, HHS.
Summary • Emergency department visits for adverse events (especially medical/surgical complications) among persons 65+ are increasing • Consumer receipt of verbal counseling regarding medications remains far below the HP 2010 target • EMR and CPOE usage is increasing and has exceeded the HP 2010 targets • Demand is approaching supply for blood donations
Progress review data and slides are available on the web at: http://www.cdc.gov/nchs/hphome.htm