
K → 崩壊の探索と 京都グループの活動
K → 崩壊の探索と 京都グループの活動. K L → 0 . KOPIO (BNL) : 笹尾 野村 (+ 新スタッフ ) 隅田 (D2) 森井 (D1) 横山 (D1) 白井 (M2) 谷口 (M2) 中島 (M1). E391a (KEK) : 笹尾 野村 隅田 (D2) 森井 (D1). K + → + . E787 (BNL) : 藤原 (D3). E949 (BNL) : 笹尾 野村 藤原 (D3) 溝内 (D3).

K → 崩壊の探索と 京都グループの活動
E N D
Presentation Transcript
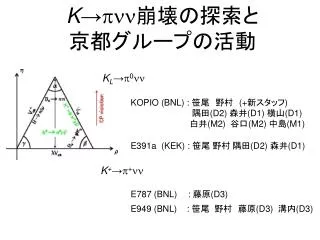
K→崩壊の探索と京都グループの活動 KL→0 KOPIO (BNL) : 笹尾 野村 (+新スタッフ) 隅田(D2) 森井(D1) 横山(D1) 白井(M2) 谷口(M2) 中島(M1) E391a (KEK) : 笹尾 野村隅田(D2) 森井(D1) K+→+ E787 (BNL) : 藤原(D3) E949 (BNL) : 笹尾 野村 藤原(D3) 溝内(D3)
KOPIO Apparatus – CG with High-lights– Beam veto Shashlyk calorimeter Eye-pipe charged veto(ビームパイプ内壁部分) 2X0 Preradiator Decay region
Beam Catcher(全面的に担当) 最下流の中性ビーム中の光子Veto 横3.6~6m(ビームの拡がりに応じて増す)、高さ30cm 中性子の数が多い 300個/microbunch (>830 MeV) 検出すべき光子 比較的高いエネルギー(>300MeV)に集中 (運動学的カットのおかげ) 性能要求 >99% for 300 MeV photon <3x10⁻³ for 830 MeV neutron 時間分解能 1 nsec 2信号分離能力 3 nsec Eye-pipe Charged Veto(デザイン、パート試験を担当) 真空槽内で荷電粒子を検出 p+<10-5 p-<10-4 プリラディエータ、カロリメータのビーム側内層をカバー(ビームパイプに沿う形) シンチ+波長変換ファイバー+高量子効率PMT 日本(京都)グループ担当箇所
エアロジェル性能評価システム– チェレンコフ発光量 – • ビームより簡易に、宇宙線より迅速に! • テーブルトップ・単色ベータビームを開発 光量測定結果 2段ソレノイド・スペクトロメータ 106Ru そのまま 1.5MeV,DE=10% 2.5MeV,DE=6% 光量のエネルギー依存を迅速に測定可能 黒:データ、赤:MC
E391a: KL→0測定実験 100mm • 測定: p0(⇒gg) + nothing • KL生成: KEK 12GeV PS • “Pencil beam” • 検出器 • 高精度の CsI カロリーメータ • 崩壊領域を完全に覆う veto 検出器 • バレル部光子 veto • ビーム周りの “Collar” 検出器 • 崩壊領域: ~10-5 Pa の高真空 • SensitivityO(10-10) • SM Prediction ~ 3x10-11 10 m g g KL n n n Z軸
Run-I 2004: 2/16~6/30 ⇒300 シフト 187 シフト: 物理データ取得 24 シフト: p0生成ターゲットを用いた較正 89 シフト: ビームチューニング等 KL生成 1次陽子ビーム取り出し: 2秒(4秒spill) 2.2×10¹² proton / spill ⇒ 5x10⁵KL /spill ~110 GB/日 ⇒ full data: 6TB Run-II 2005: 2/3~3/17(予定) ⇒100 シフト 改良点 (後述) 新collar counter Multi-hit TDC ⇒ レート耐性の強化 ビーム中に Be absorber を挿入 E391a Data Taking 2004.1.22 検出器完成
Run-I: 解析の現状 • バックグラウンドの見積り • single p0分布の比較 • Final plot (1 week data) and Sensitivity • 1 week data analysis • KL→ 3p0 ,KL→ 2p0 による KLビームの理解 Next slide … 崩壊点 3p0の質量 運動量分布 ±20% Recon Mass (GeV/c2) Zvtx (cm) Pt (GeV/c)
Run-I: 解析の現状 (2) バックグラウンドの予測 各崩壊モード分布 (MC) 2g trigger data MC vs Data (1week data) 中性子が真空膜に衝突 Zvtx (cm)
Run-I: 解析の現状 (3) Final Plot (1Week data) No significant signal/background observed. Sensitivity ~ 10-8
Run-II での改良点 • Core beamが真空膜に当たっている (改)ビームに対して正確に固定 • Halo neutron起源のバックグラウンド (改)新Collar counter • K/n比と False Veto (改) Be absorber RUN-I RUN-II RUN-II with Be CC02 CC03 CC04 CC05 CC06 CC07 FB MB CV CsI BHCV BA BACV RUN-I RUN-II RUN-II with Be Accidental veto の確率 PT (GeV/c) Vertex Zvtx(cm)
京都グループの貢献 • 隅田(D2) • Run-I • DAQ システム構築 • 検出器組み立て • シミュレーション • Run-II • 物理解析 • 森井(D1) • Run-II • 各検出器のエネルギー較正 • KL→ 3p0 による CsI の較正
E391a : まとめと今後の展望 • Run-I • 2004/Feb/16 ~ Jun/30 300シフト (187シフト 物理ラン) • 1week data の解析 • 10-8のsensitivity • 問題点の理解 • バックグラウンドレベルの見積りが進行中 • Run-II • 2005/Feb/3 ~ Mar/17 100シフト • Run-I における問題点への対策 • core neutron ⇒ 真空膜の張り直し ⇒ 効果を確認(x1/5) • halo neutron ⇒ 新collar counterの導入 • n/K比, acceptance ⇒Be absorberの導入⇒acc向上を確認 • 目的 • 解析方法の確立 • バックグラウンドが十分少いことの確認 ⇒秋のPS運転でさらに100 シフトを申請中 10-10オーダの感度を目指す
K+→+崩壊の探索 • Introduction • Experimental Method • Analysis • Results
Vtd l Motivation (Flavor Changing Neutral Current: FCNC) • Second order: Top quark dominant • Vtd vertex • Theoretical uncertainty Good decay to measure |Vtd| SM prediction Current measurement
Detection Strategy K+→m+ K+→+ (nothing) K+→+p0 K+→m+ Charged Particle Momentum from K+
K+ generation • BNL AGS 24GeV/c (down to 21.5 GeV/c) • 2sec beam-on in 5sec repetition • 6.0×10¹³ proton/spill on Target • K+/p+ electrostatic separator (K/p ratio = 4/1) • 3.5×10⁶ K+/spill at P of 700MeV/c Pt target 19.6 m in length
Platinum target After E949 data taking Before E949 data taking
K+ generation • BNL AGS 24GeV/c (down to 21.5 GeV/c) • 2sec beam-on in 5sec repetition • 6.0×10¹³ proton/spill on Target • K+/p+ electrostatic separator (K/p ratio = 4/1) • 3.5×10⁶ K+/spill at P of 700MeV/c Pt target 19.6 m in length
K+ generation • BNL AGS 24GeV/c (down to 21.5 GeV/c) • 2sec beam-on in 5sec repetition • 6.0×10¹² proton/spill on Target • K+/p+ electrostatic separator (K/p ratio = 4/1) • 3.5×10⁶ K+/spill at P of 700MeV/c Pt target 19.6 m in length
E949 detector end view (upper half) E949 Detector 1T magnetic field phi (1) K+/p+ ID in Cerenkov counter (2) Stop K+ in scintillator fiber target (3) Wait at least 2ns for K+ decay (4) Measure P in drift chamber (5) Measure range R and energy E in target and range stack(RS) (6) Stop p+ in range stack (7) Observe p+ →m+ →e+ in RS (8) Veto extra activities. E949 detector side view (upper half) Blue : Updated system for E949
E949 detector end view (upper half) E949 Detector 1T magnetic field phi (1) K+/p+ ID in Cerenkov counter (2) Stop K+ in scintillator fiber target (3) Wait at least 2ns for K+ decay (4) Measure P in drift chamber (5) Measure range R and energy E in target and range stack(RS) (6) Stop p+ in range stack (7) Observe p+ →m+ →e+ in RS (8) Veto extra activities. E949 detector side view (upper half) Blue : Updated detectors for E949
Stop K+ in Scinti. Fiber Target Tout – Tin (ns) Kaon decay Pion scattering 0ns 20ns 15cm
E949 detector end view (upper half) E949 Detector 1T magnetic field phi (1) K+/p+ ID in Cerenkov counter (2) Stop K+ in scintillator fiber target (3) Wait at least 2ns for K+ decay (4) Measure P in drift chamber (5) Measure range R and energy E in target and range stack(RS) (6) Stop p+ in range stack (7) Observe p+ →m+ →e+ in RS (8) Veto extra activities. E949 detector side view (upper half) Blue : Updated system for E949
E949 detector end view (upper half) E949 Detector 1T magnetic field phi (1) K+/p+ ID in Cerenkov counter (2) Stop K+ in scintillator fiber target (3) Wait at least 2ns for K+ decay (4) Measure P in drift chamber (5) Measure range R and energy E in target and range stack(RS) (6) Stop p+ in range stack (7) Observe p+ →m+ →e+ in RS (8) Veto extra activities. E949 detector side view (upper half) Blue : Updated system for E949
Trace p+ decay sequence • p+ life time : 26 ns • +energy : 4MeV • + life time : 2.2 ms p+ stop counter Time (ns) 0 ns 100 ns
E949 detector end view (upper half) E949 Detector 1T magnetic field phi (1) K+/p+ ID in Cerenkov counter (2) Stop K+ in scintillator fiber target (3) Wait at least 2ns for K+ decay (4) Measure P in drift chamber (5) Measure range R and energy E in target and range stack(RS) (6) Stop p+ in range stack (7) Observe p+ →m+ →e+ in RS (8) Veto extra activities. E949 detector side view (upper half) Blue : Updated system for E949
DAQ Summary (60 weeks approved) • Physics run in 2002 (12 weeks) • beam intensity x2 • Detector worked very well • Smooth data taking • Beam condition was not optimized 2 events observed
1 2
1 Nature Feb/7/2002
2 Nature Feb/14/2002
Analysis Analysis Strategy • Blind Analysis • Measure Background level with real data • To avoid bias, 1/3 of data cut tuning 2/3 of data background measurement • Characterize backgrounds using back- ground functions • Likelihood Analysis
Neural net function for and Background distribution Backgrounds can be characterized using background functions Example : muon backgrounds Range deviation Decay chain trace
Likelihood Analysis Divide signal region into cells. T. Junk [NIM A434, 435 (1999)] For the cell , # of expected signal # of expected background … from background functions # of actually observed event Likelihood estimator
NK (1012) Total acceptance (%) Sensitivity (10-10) Sensitivity and Background Sensitivity diff Background Note: 10% larger acceptance results in more backgrounds In the likelihood analysis, the ratio for each cell is a key. The total background level isn’t a mater in signal region. All cuts are fixed and ready to open the BOX !
Opening the BOX Range (cm) and Energy (MeV) plot after all other cuts applied. signal box Single candidate found.
Branching ratio & Confidence level • E949 result alone: • Combine E787 and E949 results increase statistics E949(02) = combined E787&E949. E949 projection with full running period. (~60 weeks) (68% CL)
Thanks to Gino Isidori Without constraints that depend on Bd mixing Effect on unitarity triangle Limits from measurements of: BR(K+ - π+νν) : ------- central value 68% interval 90% interval
E949 has observed an additional candidate. (68% CL, PNN1 region) from the combined E787 and E949 result. • We need more data. - Further E949 running? - Analysis of “below (PNN2) region” Conclusions
Motivation is clear and simple • To construct the K unitarity triangle and confirm the “golden” relation which is valid in the SM and MFV. • Use K+p+ n nandK0p0 n n to measure the CPV related elements (sin2b)p n n = (sin2b)J/Ks A.J. Buras et.al hep-ph/0405132
BNL-E949 detector -- Rejecting beam backgrounds Top half of side view m+n e+n n Target fibres p+ K cluster p cluster n n cerenkov B4 Beam 1 K Charge exchange K cerenkov K decay Beam 2 Beam backgrounds include pion scattering, kaon decay-in-flight, and charge-exchange reactions.
BNL-E949 detector -- Powerful and redundant particle ID Top half of end view E949 R/P dE/dx E787 Photon veto -ID from its decay chain. Resolutions: DP/P ~ 1.1%; DR/R~ 3.0%; DE/E ~ 1.0%/E. Rejections:~105 for m;~106 for photon with 4p sr coverage.