Download
1 / 4
40 likes | 63 Views
Comparative analysis of intergenic regions between E. ruminantium strain Gardel and selected Rickettsiales, highlighting gene colinearity and conservation. Includes figures on codon and amino acid usage, gene plasticity, and homologous gene pairs.

E N D
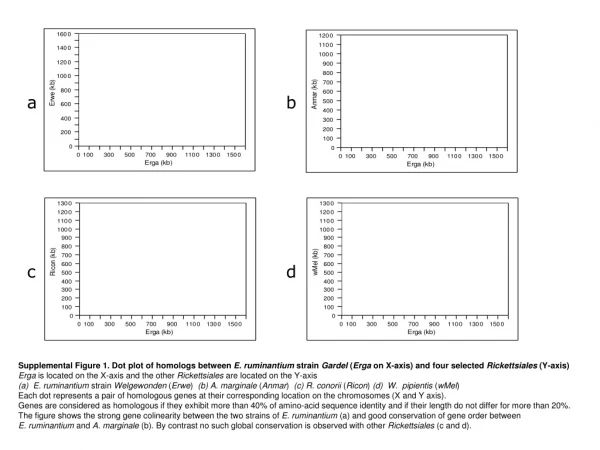
a b c d Supplemental Figure 1. Dot plot of homologs between E. ruminantium strain Gardel (Erga on X-axis) and four selected Rickettsiales (Y-axis) Erga is located on the X-axis and the other Rickettsiales are located on the Y-axis (a) E. ruminantium strain Welgewonden (Erwe) (b) A. marginale (Anmar) (c) R. conorii (Ricon) (d) W. pipientis (wMel) Each dot represents a pair of homologous genes at their corresponding location on the chromosomes (X and Y axis). Genes are considered as homologous if they exhibit more than 40% of amino-acid sequence identity and if their length do not differ for more than 20%. The figure shows the strong gene colinearity between the two strains of E. ruminantium (a) and good conservation of gene order between E. ruminantium and A. marginale (b). By contrast no such global conservation is observed with other Rickettsiales (c and d).
0,5 N 0,6 0,4 Axis2 (15%) Axis2 (6%) 0,4 0,3 I Y Q 0,2 H E 0,2 D T K 0,1 F R S 0 P 0 W L -0,1 C A V -0,2 G M -0,2 b -0,3 -0,4 a -0,4 -0,6 Axis1 (20%) -0,5 Axis1 (17%) -0,6 -0,8 -0,6 -0,4 -0,2 0 0,1 0,3 0,5 0,7 0,9 -0,9 -0,7 -0,5 -0,3 -0,1 0 0,1 0,3 0,5 Supplemental Figure 2. Codon usage (a) and aminoacid usage (b) of genes in E. ruminantium strain Gardel (Erga) Each dot represents a gene and the plots correspond to the first and second axis of a Correspondence Analysis (CA) on the codon usage (a) and aminoacid usage (b). Green dots represent genes on the leading strand and red dots represent genes on the lagging strand. Circles represent a selection of a cluster of genes in (b). They correspond to protein enriched in Phenylalanine (F) and Tryptophan (W).
Erga Erga_02630 birA gst potA recR znuA znuC ubiB Erwe Erwo Anmar Supplemental Figure 3. Size plasticity in intergenic regions of E. ruminanitum and A. mariginale A segment of the E. ruminantium strain Gardel (Erga) chromosome is aligned with homologous segments from E. ruminantium strains Welgewonden (Erwe and Erwo) and A. marginale (Anmar). Genes are represented by arrows and colored according to homology. Tandem repeats are represented by black rectangles on the top of each map. This segment was chosen to illustrate the gene colinearity, the variation of intergenic distances and their correlation with the occurrence of tandem repeats (see text). The computations and figures were produced using the Genostar platform.
gltA guaA Erwe 1 053 bp a Erwo gltA guaA 850 bp Erwe b 2 088 bp Erwo 2 307 bp Supplemental Figure 4.Size plasticity of intergenic regions of Erwe and Erwo Two examples of the variation of intergenic sizes between E. ruminantium strains WelgewondenErwe and Erwo and their relation with tandem repeats. Genes are represented by arrows and colored according to their homology relationship. Tandem repeats are represented by purple rectangles. (a) : the intergenic distance is longer in Erwe due to the gain of 29 copies of 9 bp. (b) : the intergenic distance is shorter in Erwe due to the loss of 1 copy of 219 bp. The computations and figures were produced using the Genostar platform.