Evaluating and Controlling Salespeople
490 likes | 785 Views
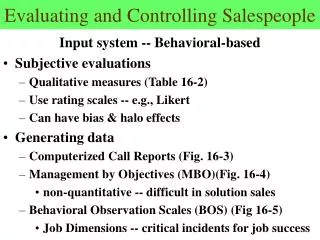
Evaluating and Controlling Salespeople. Input system -- Behavioral-based Subjective evaluations Qualitative measures (Table 16-2) Use rating scales -- e.g., Likert Can have bias & halo effects Generating data Computerized Call Reports (Fig. 16-3) Management by Objectives (MBO)(Fig. 16-4)

Evaluating and Controlling Salespeople
E N D
Presentation Transcript
Evaluating and Controlling Salespeople Input system -- Behavioral-based • Subjective evaluations • Qualitative measures (Table 16-2) • Use rating scales -- e.g., Likert • Can have bias & halo effects • Generating data • Computerized Call Reports (Fig. 16-3) • Management by Objectives (MBO)(Fig. 16-4) • non-quantitative -- difficult in solution sales • Behavioral Observation Scales (BOS) (Fig 16-5) • Job Dimensions -- critical incidents for job success
Evaluating and Controlling Salespeople Combining Input & Output Measures Call Productivity Ratios Calls per day = # Calls _ # Days worked Calls per account = # Calls_ # of Accounts Planned Call = # Planned calls Total # Calls Batting Average = # Orders__ Total # Calls
Evaluating and Controlling Salespeople Combining Input & Output Measures Expense Ratios Expense to Sales = Expenses Sales Cost per Call = Total Costs # of Calls
Evaluating and Controlling Salespeople Combining Input & Output Measures Account Related Ratios Sales to Account = Dollar Sales _ # Accounts Average Order Size = Dollar Sales # Orders Growth Ratio = # New Accounts Total # Accounts Account Success = Accounts sold_ Total # Accounts
Evaluating and Controlling Salespeople Models Combining Input & Output Controls • Inputs • Behavior • # Calls • Days worked • Expenses • Selling vs. non- • selling time • Quotas • Outputs • # Orders • Order Size • # New, lost, • or active • accounts • Inputs • Attitude • Motivation • Skills • Abilities • Job Perception
Evaluating and Controlling Salespeople Models Combining Input & Output Controls • Ranking Procedures • Widely used, simple to use, easy to understand • Add ranks for overall performance measure • Alternatives to sales/salesperson • Sales to potential -- good coverage of (limited) market • Sales to quota -- ability to increase revenue • Sales per order -- profitability relative to size of customer • Batting average -- efficiency of calls • Gross margin percentage -- ability to control price selling best mix of products • Variation -- weight importance of each criterion
Evaluating Sales Force Performance Cost Analysis • What costs are relevant? Net Sales Less Variable Costs: Cost of Goods Sold Sales Commissions Equals: Contribution Margin Less: Direct Fixed Selling Costs Equals: Profit Contribution
Evaluating Sales Force Performance Cost Analysis • Object affects direct vs. indirect cost class: Cost By Territory By Product P-O-P display Direct Direct Salesperson Salary Direct Indirect Product Manager Salary Indirect Direct VP Operations Salary Indirect Indirect
Evaluating Sales Force Performance Product Costs • CGS + Commissions higher for computers • paying too much for parts • competition has driven down selling prices • salespeople cutting computer prices to make deals -- possible actions: • limit price negotiation capabilities • shift to a gross margin commission • change commission structure to emphasize accessories & software
Evaluating Sales Force Performance District Costs • Sales managers vary in ability to control expenses • 3-way: district by product by cost • watch for price cutting by salespeople • watch for excessive emphasis on low margin goods
Evaluating Sales Force Performance Account Cost to Serve Total Cost to serve account • Cost to Serve = • Usually decline with revenue • Help identify best accounts • Downsizing & Profits (T 15-7) • Consider using DEA (Programming) Revenue from Account
Table 15-1 Output Measures Used in Sales Force Evaluation Source: Donald W.Jackson, John L. Schlacter, and William G. Wolfe, “Examining the Bases Utilized for Evaluating Salespeoples’ performance,” Journal of Personal Selling & Sales Management, Vol. 15, No. 4 (Fall 1995), p. 61.
Table 15-2 Input or Behavior Bases used in Sales Force Evaluation Source: Donald W.Jackson, John L. Schlacter, and William G. Wolfe, “Examining the Bases Utilized for Evaluating Salespeoples’ performance,” Journal of Personal Selling & Sales Management, Vol. 15, No. 4 (Fall 1995), p. 62.
Table 15-4 Comparing Dollar and Unit Sales at the Bear Computer Company 1996 Sales 1997 Sales
Table 15-5 Expense Analysis by Product Line, Bear Computer Company, 1997
Table 15-6 Qualitative Bases used in Sales Force Evaluation Source: Donald W.Jackson, John L. Schlacter, and William G. Wolfe, “Examining the Bases Utilized for Evaluating Salespeoples’ performance,” Journal of Personal Selling & Sales Management, Vol. 15, No. 4 (Fall 1995), p. 63.
Table 15-8 Measuring Territory Profit Output for Bear Computer Company
Table 15-9 Evaluating Performance Using Behavior and Outcome Data Performance factors Pete Jones Ann Smith Sales (annual) $1,400,000 $1,100,000 Days worked 210 225 Calls 1,200 1,500 Orders 480 750 Expenses $19,000 $14,900 Calls per day 5.7 6.7 Batting average (orders per calls) 40% 50% Sales per order $2,916 $1,466 Expenses per call $15.83 $9.93 Expenses per order $39.58 $19.86 Expenses as % of sales 1.35% 1.35%
Table 15-10 Ranking Salespeople on 10 Input/Output factors Ranking Factors Ford Bell Shaw Mann Gold Dollar Sales 2 3 4 5 Sales to Potential 5 3 4 2 Sales to Quota 5 4 2 3 Sales per Order 5 4 3 2 Number of Calls 2 5 3 4 Orders per call 4 2 5 3 Gross Margin Percent 5 3 4 2 Direct Selling Costs 4 3 5 2 New Accounts 4 2 5 3 Number of Reports Turned In 4 3 5 2 Total of Ranks 36 28 30 31 25
Figure 15-3 Ranking Salespeople on 10 Input/Output factors Millions $ 3.87 3.66 3.44 3.23 3.02 2.80 2.59 2.38 2.16 1.95 1.74 1.53 1.31 1.10 COMPROMISERS Avg sales $3.17 Avg contribution $1.13 Avg contribution % 35.8 Age 45 Calls 1122 Number of salespeople 18 STARS Avg sales $2.91 Avg contribution $1.09 Avg contribution % 37.4 Age 37 Calls 888 Number of salespeople 11 SALES YR 2 Avg sales $2.03 Avg contribution $ .75 Avg contribution % 37.1 Age 35 Calls 921 Number of salespeople 16 SLOWPOKES Avg sales $1.78 Avg contribution $ .64 Avg contribution % 35.8 Age 44 Calls 958 Number of salespeople 11 LAGGARDS 34.8 35.1 36.0 36.6 37.2 37.8 38.7 Contribution Margin (%)
Table 15-11Relative performance efficiency for Sales Rep 22 Value if Value 100% Variable Type Variable Name Measured Efficient Slack Output Percent Quota Attained (%) 100 120 20 Output Supervisor Evaluation 5 5 0 Output Sales Volume ($) 45,000 50,500 5,500 Input Sales Training 5 5 0 Input Salary ($) 20,000 18,000 2,000 Input Management Ratio 3 2 1 Input Territory Potential ($) 60,500 50,000 10,500 Reference Set Efficiency = 0.85 Iterations = 10 Influence Salesperson 7 0.49 Salesperson 20 0.43 Salesperson 45 0.08 Source: James S. Boles, Naveen Donthu, and Ritu Lohtia, “Salesperson Evaluation Using Relative Performance Efficiency: The Application of Data Envelopment Analysis,” Journal of Personal Selling & Sales Management, Vol. 15, No. 3 (Summer 1995), p. 44.
Figure 15-2 A Model of Salesperson Evaluation Output-based System Input-based System Results Sales revenues Sales growth Sales/quota Sales/potential New accounts Contribution margins Contribution percentage Behavior Calls Reports Complaints Demonstrations Dealer meetings Display set up Travel/entertainment expenses Salesperson Evaluation
Table 15-7 Measuring Sales Force Output for Bear Computer Company 1 2 3 4 56 7 8 Market Sales ‘96 Sales ‘97 Potential Sales Percentage Sales Jan-Sept Jan-Sept Dollar Sales index Quota of Quota Variance Territory (000) (000) Change Growth (percent) (000) Achieved (000) Jones $ 750 $ 825 + $75 10.0% 26.0% $ 943 87.0% – $118 Smith 500 570 + 70 14.0 15 543 105 + 27 Brown 1025 1110 + 85 8.3 32 1160 96 – 50 West 960 1000 + 40 4.2 27 977 102 + 23 $3235 $3505 +$270 8.3% 100.0% $3623
Figure 15-1: A Sales Force Evaluation Model Set goals and objectives for sales force, including: Revenues Contribution profits Market share Expense ratios Take Corrective Action Design sales plan Set product performance standards for: Organization Salespeople Regions Accounts Districts Measure results against standard
Evaluating Sales Force Performance Fleet Car Management -- A Motivator • Salesperson owned car (per mile travel allowance) • Salesperson gets car preference • Allowances rarely cover full salesperson car costs • Company owned & managed cars • Ties up a lot of cash • Costs less than salesperson owned car • Leased sales fleet of cars • Frees up cash • Company performs routine maintenance
CallsOrdersSales $ Days WorkedCallsOrders $ Sales = Days worked x Batting Average Average Order Size Call Rate $ Sales = Days worked x Evaluating and Controlling Salespeople Models Combining Input & Output Controls • Four Factor Model • How can sales be increased? • Optimum Number of sales calls to maximize profits? • Who is doing best? Ann or Pete? • What management strategies for Pete? for Ann?
Evaluating Sales Force Performance Contribution Margin Sales C of GS & Other Variables Costs Contribution Margin Direct Allocable Fixed Selling Costs Profit Contribution Full Cost Sales Less: C of GS Equals: Gross Margin Less: Operating Expenses (Direct + Indirect Allocated) Equals: Profit Contribution Profitability Analysis
Evaluating Sales Force Performance Profitability Analysis • “Full Cost” Approach • charge recruiting, training, sales promo & other marketing expenses to sales manager • allocation is somewhat arbitrary • not under sales manager control
Evaluating Sales Force Performance In-Class Exercise 15-1 -- “Which Profits?” 1. Why would a company that used to use only sales as a performance criteria for its sales force wish to consider profitability? 2. What criteria should be established to construct a workable performance evaluation system? 3. What are the pros and cons of alternative profit measures? 4. What other problems need to be considered?
Evaluating and Controlling Salespeople In-Class Exercises 16-1 “I Know These Sales Figures Stink” 1. What activities should be completed in the performance evaluation process? 2. What should take place prior to a performance review meeting? 3. What is covered in the meeting? 4. What to do if an employee disagrees with the performance ratings? 5. What are additional suggestions for providing feedback to others?
Evaluating and Controlling Salespeople In-Class Exercises 16-1 “I Know These Sales Figures Stink” 6. How do you handle hostile reactions? 7. What additional questions should Sherrie ask of the veteran sales manager? 8. What consideration should be given to a large customer going out of business? 9. Is sales, the bottom line, the only measure that should be used for evaluating performance? 10. What are the companies responsibilities in this role play?
Evaluating and Controlling Salespeople Input vs. Output Systems Salary Compensation Commission Input System favored Output
Evaluating and Controlling Salespeople Using Judgment Models -- Ranking Procedures 1. How do the six salespeople compare with one another? -- Rank them for 1 to 6 overall. 2. Which of the six would you promote to Field Sales Supervisor (sales manager position)? 3. If you were opening a new territory which is promising to be quite high in sales potential and thus both lucrative and challenging, and you had to assign one of the six to that territory, which salesperson would you transfer to that territory?
Evaluating and Controlling Salespeople Using Judgment Models -- Ranking Procedures 4. If you had to reduce the sales force to only 5 salespeople, and thus had to terminate one of the salespeople, which one would you terminate? Why? 5. If you had a $10,000 budget for bonuses for your sales force and had to pay it all out, how much of the $10,000 would you give to each of the salespeople? You may allocate the $10,000 in any manner you wish, as long as the total is exactly $10,000.
Evaluating and Controlling Salespeople Using Judgment Models -- Ranking Procedures • Results of a sample of 242 sales managers • How do your results compare with the managers? • Situation specific evaluations • Overall evaluations • Situation Specific Predictive Ability • which model works best?
Evaluating and Controlling Salespeople Summarizing Sales force Performance • Performance Matrix • Shows interaction of 3 or more variables at a time • Identifies reps for rewards and punishments • Helps find subtle interactions • Findings in Figure 16-6 • Reps begin career selling high margin mix of products • Reps end career by sacrificing margins for revenue • Laggards represent a plateauing problem • Laggards should make more contractor calls • If looking for $$ -- reward compromisers • If looking for profits -- reward the stars
Evaluating Sales Force Performance Profitability Analysis • Residual Income Analysis • Sales growth is desirable as long as profits exceed cost of capital • Most comprehensive single measure of sales force performance • Existing control factors all included • Expressed in dollars makes it easier to set sales manager incentives • Directly related to corporate objectives
Evaluating Sales Force Performance Profitability Analysis • Return on Assets Managed (ROAM) Profit Contrib. Sales Sales Assets Managed • Assets under sales management control • District Analysis • Assets managed poorly in District 4 • Profit contribution greatest in District 1 X
Evaluating Sales Force Performance Profitability Analysis • ROAM disadvantages • focus on lower assets (inventory + acct. receivable) • does not consider sales level or growth • Solution: Residual Income Analysis (RIA) Profit Contribution Less: Acct receivable costs Inventory carrying costs Equals Residual Income
Evaluating Sales Force Performance Sales Force Evaluation Model • Sales Analysis Principles • 80/20 -- 20% of customers yield 80% sales • Iceberg -- sales figures tip of iceberg -- need more • Gathering Sales Data • DSS • hand held computers for field • Steps in Sales Analysis • Pick unit for analysis - by division, district, etc. • Select variables for cross classification - by product • Choose performance measures -- sales to quota, etc.
Evaluating Sales Force Performance • The Big Picture • Start with aggregate sales by year • Look for changes and trends -- market share, volume • Refining through Cross Classification • Sales by Region • reward areas of strength? • move into areas of weakness • Sales by Product Line • Are you selling what firm wants? or what salespeople want? • Balance long vs. short term goals
Evaluating Sales Force Performance • Refining Through Cross Classification • Dollar Vs. Unit Sales • When price change (inflation) distorts dollar figures • Good for big ticket items • Sales by Distribution Channel • tends to change over time • asks who customers really are • Sales by Customer Type • illustrates 80/20 principle • how to deal with small accounts
Evaluating Sales Force Performance • Cross Classification Techniques • Multi-way Tables • Varying Customer Classifications • Product Lines vs. Product Categories • Brands as Product Class
Table 15-3 Sales Data for Bear Computer Company 1 2 3 4 Company Percentage Industry Company Volume Change from Volume Market Share Year ($ millions) Previous Year ($ millions) (percent) 1997 26 + 8.3 300 8.6 1996 24 +14.3 219 10.9 1995 21 +23.5 165 15.7 1994 17 --- 125 13.6
Table 15-7 Measuring Sales Force Output for Bear Computer Company 1 2 3 4 56 7 8 Market Sales ‘96 Sales ‘97 Potential Sales Percentage Sales Jan-Sept Jan-Sept Dollar Sales index Quota of Quota Variance Territory (000) (000) Change Growth (percent) (000) Achieved (000) Jones $ 750 $ 825 + $75 10.0% 26.0% $ 943 87.0% – $118 Smith 500 570 + 70 14.0 15 543 105 + 27 Brown 1025 1110 + 85 8.3 32 1160 96 – 50 West 960 1000 + 40 4.2 27 977 102 + 23 $3235 $3505 +$270 8.3% 100.0% $3623
Figure 15-3 Ranking Salespeople on 10 Input/Output factors Millions $ 3.87 3.66 3.44 3.23 3.02 2.80 2.59 2.38 2.16 1.95 1.74 1.53 1.31 1.10 COMPROMISERS Avg sales $3.17 Avg contribution $1.13 Avg contribution % 35.8 Age 45 Calls 1122 Number of salespeople 18 STARS Avg sales $2.91 Avg contribution $1.09 Avg contribution % 37.4 Age 37 Calls 888 Number of salespeople 11 SALES YR 2 Avg sales $2.03 Avg contribution $ .75 Avg contribution % 37.1 Age 35 Calls 921 Number of salespeople 16 SLOWPOKES Avg sales $1.78 Avg contribution $ .64 Avg contribution % 35.8 Age 44 Calls 958 Number of salespeople 11 LAGGARDS 34.8 35.1 36.0 36.6 37.2 37.8 38.7 Contribution Margin (%)