Download
1 / 46
460 likes | 481 Views
Internet Infrastructure Measurement: Challenges and Tools. Prasad Narayana CS495: Internet Measurement and its Reverse Engineering Thursday Apr 13, 2006. Outline. Motivation Challenges Tools Conclusion. Why Measure ?.

E N D
Internet Infrastructure Measurement: Challenges and Tools Prasad Narayana CS495: Internet Measurement and its Reverse Engineering Thursday Apr 13, 2006
Outline • Motivation • Challenges • Tools • Conclusion
Why Measure ? • Internet, with all its idiosyncrasies, appears to be doing its job rather well • Message sharing, E-Commerce, E-Governance, Telecommuting, Knowledge sharing, Games etc. • Internet, with all its quirks, has prevailed in spite of the exponential growth witnessed in the last decade • So, why bother measuring various aspects of it then ?
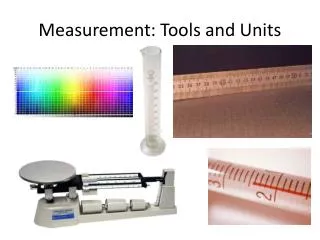
What to Measure ? • Physical Properties • Devices (routers, NAT boxes, firewalls, switches), Links (wired, wireless) • Topology Properties • Various levels – Autonomous Systems (AS), Points of Presence (PoP), Routers, Interfaces • Traffic Properties • Delays (Transmission, Propagation, Queuing, Processing etc.), Losses, Throughput, Jitter
Again, Why Measure ? • Although Internet works, it is far from being ideal • Measurements of various aspects of it will: • Help us to better understand why it works the way it does • Help us to diagnose known problems and lead us one step closer to their solutions • Help us to design new features that the Internet should provide to enable next-generation application requirements Simply put, “Internet Measurements is key to the design of the next-generation Internet”
Next • Motivation • Challenges • Tools • Conclusion
What are we faced with ? • Given the list of ASes, is there a built-in tool/function, which outputs the topology of the Internet ? • Given a path from source to destination, is there built-in a tool/function, which can determine how long a packet will take to travel to the destination ? • Given a set of routers along the path of a packet, is there a built-in tool/function, which can determine the delays introduced by each of the routers ? The answer to all of these questions is NO
Why don’t we have such functions ? • The answer is two-worded: “Poor Observability” • Reasons for this: • Core Simplicity • Layered architecture • Hidden Pieces • Administrative Barriers
Core Simplicity • Keep It Simple Stupid (KISS) design principle • Stateless nature w.r.t connections/flows • End-to-End argument As network elements do not track packets individually, interaction of traffic with the network is hard to observe
Layered Architecture • IP hourglass model hides details of lower level layers • While this provides abstraction improving interoperability, it impedes detailed visibility of lower layers • Hence, even detailed measurements such as packet capture cannot detect differences between two types of links
Hidden Pieces - Middleboxes • Firewalls – provide security • Traffic Shapers – assist in traffic management • Proxies – improve performance • NAT boxes – utilize IP address space efficiently Each of these impedes visibility of network components. E.g.: • firewalls may block active probing requests • NATs hide away the no. of hosts and the structure of the network on the other side
Administrative Barriers • Owing to the competition-sensitive nature of the data required (topology, traffic etc.), ISPs actively seek to hide these details from outside discovery • Information that they do provide are often simplified. • E.g.: Instead of publishing router-level topologies, ISPs often publish PoP-level topologies
Next • Motivation • Challenges • Tools • Conclusion
Tools Classification • Active Measurement • Passive Measurement • Fused/Combined Measurement • Bandwidth Measurement • Latency Measurement • Geolocation • Others
Active Measurement Tools • Methods that involve adding traffic to the network for the purposes of measurement Ping: Sends ICMP ECHO_REQUEST and captures ECHO_REPLY • Useful for measuring RTTs • Only sender needs to be under experiment control OWAMP: A daemon running on the target which listens for and records probe packets sent by the sender • Useful for measuring one-way delay • Requires both sender and receiver to be under experiment control • Requires synchronized clocks or a method to remove clock offset
Traceroute • Useful for determining path from a source to a destination • Uses the TTL (Time To Live) field in the IP header in a clever but distorted way • A large scale measurement system called skitter uses traceroute to discover network topology
IP protocol version number 32 bits total datagram length (bytes) header length (bytes) type of service head. len ver length for fragmentation/ reassembly fragment offset “type” of data flgs 16-bit identifier max number remaining hops (decremented at each router) time to live upper layer Internet checksum 32 bit source IP address 32 bit destination IP address upper layer protocol to deliver payload to E.g. timestamp, record route taken, specify list of routers to visit. Options (if any) data (variable length, typically a TCP or UDP segment) IP Header and the TTL field
Traceroute Problem • Suppose the path between A and D is to be determined using traceroute X Y D A B C
Traceroute Process X Y D A B: “time exceeded” Dest = D TTL = 1 B C
Traceroute Process X Y D A C: “time exceeded” Dest = D TTL = 2 B C
Traceroute Process X Y D A D: “echo reply” Dest = D TTL = 3 B C
Traceroute issues • Path Asymmetry (Destination -> Source need not retrace Source -> Destination) • Unstable Paths and False Edges • Aliases • Measurement Load
Unstable Paths and False Edges Inferred path: A -> B -> Y Y: “time exceeded” Dest = D TTL = 2 X Y D A B: “time exceeded” Dest = D TTL = 1 B C
Aliases • IP addresses are for interfaces and not routers • Routers typically have many interfaces, each with its own IP address • IP addresses of all the router interfaces are aliases • Traceroute results require resolution of aliases if they are to be used for topology building
Measurement Load • Traceroute inserts considerable load on network links if attempting a large-scale topology discovery • Optimizations reduce this load considerably E.g.: • If single source is used, instead of going from source to destination, a better approach is to retrace from destination to source • If multiple sources and multiple destinations are used, sharing information among these would bring down load considerably
System Support • Efficient packet injection and accurate measurement of arrival and departure times are best done at kernel level • Using Scriptroute, unprivileged users can inject and capture packets • Periscope’s API helps define new probing structures and inference techniques for extracting results from arrival patterns of responses • Unrestricted access to the network interface raises security concerns
Passive Measurement • Methods that capture traffic generated by other users and applications to build the topology • Routeview repository collects BGP views (routing tables) from a large set of ASes • Similarly, OSPF LSAs can be captured and processed to generate router graphs within an AS
Passive Measurement – Advantages and Disadvantages • Large set of AS-AS, router-router connections can be learned by simply processing captured tables • However, especially using BGP views, there could be potential loss of cross-connections between ASes which are along the path • Secondly, route aggregation and filtering tends to hide some connections • Also, multiple connections between ASes will be shown as a single connection in the graph
Bandwidth Measurement • Bandwidth – amount of data the network can transmit per unit time • Streaming media applications, server selection, overlay networks etc. require ways to measure bandwidth • Three kinds of bandwidth – • capacity: max throughput a link can sustain, • available bandwidth: capacity – used bandwidth and • bulk transfer capacity: rate that a new single long-lived TCP connection would obtain over a path
Bandwidth Measurement Methods • These focus on observing how packet delay (queuing and transmission) is affected by link properties Four types: • Packet-pair Methods • Size-delay Methods • Self-induced Congestion • Bulk Transfer Capacity Measurement
Packet-Pair Methods • Methods to measure capacity and available bandwidth • Involve sending probe packets with known inter-packet gaps and measuring the same gap downstream • Capacity is calculated using the eqn: C = L / max delta, where C is the capacity, L is the length of probe packets, max delta is the maximum inter-packet gap measured downstream • Assumes there is no cross-traffic
Size Delay Methods • Useful for measuring link capacities on each link along a path • Based on the observation that transmission delay is affected by link capacity and packet size • The idea is to send many different sized packets and measure the difference in delays affected by packet size. • Then the capacity of each link will be a function of these differences • Method assumes there is no cross-traffic, no queuing delays, no variation in packet size • Measurements become less accurate if the length of the path grows
Caveats in Bandwidth Measurements • High rate links like OC-192 make it difficult to measure bandwidth accurately because of small delays • Wireless links affect rate dramatically on fine timescales • FIFO order is not guaranteed in wireless links • Layer 2 devices can cause underestimation of a IP hop’s capacity by introducing additional transmission delays
Geolocation • Given the network address of a target host, what is the host’s geographic location ? • The answer to this is useful for a wide variety of social, economic and engineering purposes • The actual location of network infrastructure sheds light on how it relates to population, social organization and economic activity
Geolocation methods • Name Based Geolocation – Extracting location details from ISPs domain names • Delay Based Geolocation – two types: • Best Landmark • Constraint-based
Landmark based geolocation • In best landmark approach, minRTT between each of the identified landmarks is measured and stored. • Then the same metric is calculated between the node in question and each of the landmarks. • The landmark with the best matching values of minRTT is the closest to the node
Constraint based geolocation • In constraint-based approach, the distances of target location from sufficient number of fixed points are calculated and using multilateration, the position is determined
Network Tomography • A process of inferring network topology, delays, packet losses etc. using only end-to-end measurements • One needs to make many assumptions about the behavior of the underlying network
Network Tomography – Multicast based method • Multicast based method e.g. to figure out the loss rates
Next • Motivation • Challenges • Tools • Conclusion
Internet Measurements are anything but straightforward… • Internet Measurement is key to designing the next generation communication network • Fundamental design principles of the current internet make it harder for measuring various aspects of it • Preliminary research has resulted in a set of basic tools and methods to measure aspects like topology, traffic etc. • Accuracy of such methods is still an open question • There is still a lot of ground to cover in this direction and this is where researchers like you come into the equation!
TTL normal usage • TTL is initialized by the sender and decremented by one each time the packet passes through a router • If it reaches zero before reaching the destination, IP protocol requires that the packet be discarded and an error message be sent back to the sender • Error message is an ICMP “time exceeded” packet