Download
1 / 34
340 likes | 358 Views
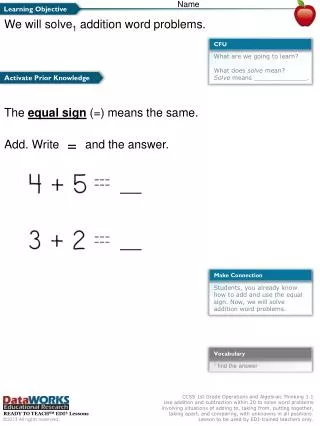
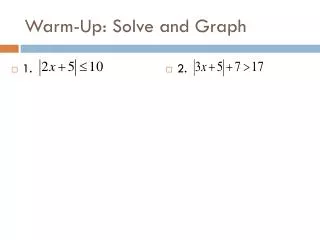
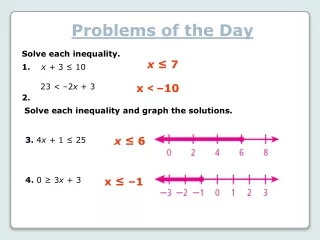
Problems of the Day Solve each inequality. 1. x + 3 ≤ 10 2. x ≤ 7. 23 < –2 x + 3. x ˂ –10. Solve each inequality and graph the solutions. x ≤ 6. 3. 4 x + 1 ≤ 25. 4. 0 ≥ 3 x + 3. x ≤ –1. Section 6-4. Solving Compound Inequalities.

E N D
Problems of the Day Solve each inequality. 1. x + 3 ≤ 10 2. x ≤7 23 < –2x + 3 x ˂ –10 Solve each inequality and graph the solutions. x ≤ 6 3. 4x + 1 ≤ 25 4. 0 ≥ 3x + 3 x ≤ –1
Section 6-4 Solving Compound Inequalities
The inequalities you have seen so far are simple inequalities. When two simple inequalities are combined into one statement by the words AND or OR, the result is called a compound inequality.
6.0 is less than or equal to pH level 6.5 is less than or equal to 6.0 6.1 6.2 6.3 6.5 6.4 Example 1: Chemistry Application The pH level of a popular shampoo is between 6.0 and 6.5 inclusive. Write a compound inequality to show the pH levels of this shampoo. Graph the solutions. Let p be the pH level of the shampoo. 6.0 ≤ p ≤6.5 6.0 ≤ p ≤ 6.5
1.0 is less than or equal to chlorine 3.0 is less than or equal to 0 1 2 3 4 6 5 Example 2 The free chlorine in a pool should be between 1.0 and 3.0 parts per million inclusive. Write a compound inequality to show the levels that are within this range. Graph the solutions. Let c be the chlorine level of the pool. 1.0 ≤ c ≤3.0 1.0 ≤ c ≤ 3.0
In this diagram, oval A represents some integer solutions of x < 10, and oval B represents some integer solutions of x > 0. The overlapping region represents numbers that belong in both ovals. Those numbers are solutions of both x < 10 andx > 0.
You can graph the solutions of a compound inequality involving AND by using the idea of an overlapping region. The overlapping region is called the intersection and shows the numbers that are solutions of both inequalities.
–5 < x + 1 AND x + 1< 2 –1 –1 –1 –1 x < 1 –6 < x AND –8 –2 –10 –6 –4 0 2 4 6 8 10 Example 3: Solving Compound Inequalities Involving AND Solve the compound inequality and graph the solutions. –5 < x + 1 < 2 Since 1 is added to x, subtract 1 from each part of the inequality. The solution set is {x:–6 < x AND x < 1}. Graph –6 < x or x ˃ –6 . Graph x < 1. Graph the intersection by finding where the two graphs overlap.
Remember! The statement –5 < x + 1 < 2 consists of two inequalities connected by AND. Example 2B shows a “shorthand” method.
8 < 3x – 1 ≤ 11 +1 +1 +1 9 < 3x ≤ 12 Example 4: Solving Compound Inequalities Involving AND Solve the compound inequality and graph the solutions. 8 < 3x – 1 ≤ 11 Since 1 is subtracted from 3x, add 1 to each part of the inequality. Since x is multiplied by 3, divide each part of the inequality by 3 to undo the multiplication. 3 < x ≤ 4 The solution set is {x:3 < x ≤ 4}.
Example 4 Continued 3 < x ≤ 4 Graph 3 < x or x ˃ 3. Graph x ≤ 4. Graph the intersection by finding where the two graphs overlap. –3 –2 0 1 2 3 4 5 –4 –1 –5
–9 < x – 10 < –5 +10 +10 +10 1 < x < 5 Example 5 Solve the compound inequality and graph the solutions. Since 10 is subtracted from x, add 10 to each part of the inequality. –9 < x – 10 < –5 The solution set is {x:1 < x < 5}. Graph 1 < x or x ˃ 1. Graph x < 5. Graph the intersection by finding where the two graphs overlap. –3 –2 0 1 2 3 4 5 –5 –4 –1
–4 ≤ 3n + 5 < 11 –5 – 5 – 5 –9 ≤ 3n < 6 –3 ≤ n < 2 Example 6 Solve the compound inequality and graph the solutions. –4 ≤ 3n + 5 < 11 Since 5 is added to 3n, subtract 5 from each part of the inequality. Since n is multiplied by 3, divide each part of the inequality by 3 to undo the multiplication. The solution set is {n:–3 ≤ n < 2}. Graph –3 ≤ n or n ≥ –3 . Graph n < 2. Graph the intersection by finding where the two graphs overlap. –3 –2 0 1 2 3 4 5 –5 –4 –1
In this diagram, circle A represents some integer solutions of x < 0, and circle B represents some integer solutions of x > 10. The combined shaded regions represent numbers that are solutions of either x < 0or x >10.
> You can graph the solutions of a compound inequality involving OR by using the idea of combining regions. The combine regions are called the union and show the numbers that are solutions of either inequality.
–8 –8 –8 −8 Example 7: Solving Compound Inequalities Involving OR Solve the compound inequality and graph the solutions. 8 + t ≥ 7 OR 8 + t < 2 Solve each simple inequality. 8 + t ≥ 7 OR 8 + t < 2 The solution set is {t: t ≥ –1 OR t < –6}. t ≥ –1 OR t < –6 Graph t ≥ –1. Graph t < –6. Graph the union by combining the regions. –8 –2 –10 –6 –4 0 2 4 6 8 10
4x ≤ 20 OR 3x > 21 x ≤ 5 OR x > 7 Example 8: Solving Compound Inequalities Involving OR Solve the compound inequality and graph the solutions. 4x ≤ 20 OR 3x > 21 Solve each simple inequality. The solution set is {x:x ≤ 5 OR x > 7 }. Graph x ≤ 5. Graph x > 7. Graph the union by combining the regions. 0 2 4 6 8 10 –8 –2 –10 –6 –4
–2 –2 –5 –5 Example 9 Solve the compound inequality and graph the solutions. 2 +r < 12 OR r + 5 > 19 Solve each simple inequality. 2 +r < 12 OR r + 5 > 19 The solution set is {r:r < 10 OR r > 14}. r < 10 OR r > 14 Graph r < 10. Graph r > 14. Graph the union by combining the regions. 4 –4 0 2 6 8 10 12 14 16 –2
7x ≥ 21 OR 2x < –2 x ≥3 OR x < –1 Example 10 Solve the compound inequality and graph the solutions. 7x ≥ 21 OR 2x < –2 Solve each simple inequality. The solution set is {x:x ≥ 3 OR x < –1}. Graph x ≥ 3. Graph x < −1. Graph the union by combining the regions. –3 –2 0 1 2 3 4 5 –5 –4 –1
Every solution of a compound inequality involving AND must be a solution of both parts of the compound inequality. (They both have to have something in common, an intersection.) If no numbers are solutions of both simple inequalities, then the compound inequality has no solutions. The solutions of a compound inequality involving OR are not always two separate sets of numbers. Some numbers may be solutions of both parts of the compound inequality.
SOLVING COMPOUND INEQUALITIES Graph the solution sets for: x < 2 or x > 7 7 2 NO SOLUTION x < 2 and x > 7 7 2 x > 2 and x < 7 7 2 x > 2 or x < 7 ALL REALS 7 2
Example 11: Writing a Compound Inequality from a Graph Write the compound inequality shown by the graph. The shaded portion of the graph is not between two values, so the compound inequality involves OR. On the left, the graph shows an arrow pointing left, so use either < or ≤. The solid circle at –8 means –8 is a solution so use ≤. x ≤ –8 On the right, the graph shows an arrow pointing right, so use either > or ≥. The empty circle at 0 means that 0 is not a solution, so use >. x > 0
Example 11 Continued Write the compound inequality shown by the graph. The compound inequality is x ≤ –8 OR x > 0.
Additional Example 12: Writing a Compound Inequality from a Graph Write the compound inequality shown by the graph. The shaded portion of the graph is between the values –2 and 5, so the compound inequality involves AND. The shaded values are on the right of –2, so use > or ≥. The empty circle at –2 means –2 is not a solution, so use >. m > –2 The shaded values are to the left of 5, so use < or ≤. The empty circle at 5 means that 5 is not a solution so use <. m < 5
Example 12 Continued Write the compound inequality shown by the graph. The compound inequality is m > –2 AND m < 5. The more common way that you will see it written is: –2 < m < 5.
Example 13 Write the compound inequality shown by the graph. The shaded portion of the graph is between the values –9 and –2, so the compound inequality involves AND. The shaded values are on the right of –9, so use > or . The empty circle at –9 means –9 is not a solution, so use >. x > –9 The shaded values are to the left of –2, so use < or ≤. The empty circle at –2 means that –2 is not a solution so use <. x < –2
Example 13 Continued Write the compound inequality shown by the graph. The compound inequality is –9 < x < –2.
Example 14 Write the compound inequality shown by the graph. The shaded portion of the graph is not between two values, so the compound inequality involves OR. On the left, the graph shows an arrow pointing left, so use either < or ≤. The solid circle at –3 means –3 is a solution, so use ≤. x ≤ –3 On the right, the graph shows an arrow pointing right, so use either > or ≥. The solid circle at 2 means that 2 is a solution, so use ≥. x ≥ 2
Example 14 Continued Write the compound inequality shown by the graph. The compound inequality is x ≤ –3 OR x ≥ 2.
Lesson Review 1. The target heart rate during exercise for a 15 year-old is between 154 and 174 beats per minute inclusive. Write a compound inequality to show the heart rates that are within the target range. Graph the solutions. 154 ≤ h ≤ 174
Lesson Review Solve each compound inequality and graph the solutions. 2. 2 ≤ 2w + 4 ≤ 12 –1 ≤ w ≤ 4 3. 3 + r > −2 OR 3 + r < −7 r > –5 OR r < –10
Lesson Review Write the compound inequality shown by each graph. 4. x < −7 OR x ≥ 0 5. −2 ≤ a < 4
Study Guide 6-4 (In-Class) • Skills Practice/Practice 6-4 (Front & Back) (Homework) Assignment