Download
1 / 15
150 likes | 171 Views
This presentation by Maarten van Rossum and Sjoerd Schenau highlights the reasons for publishing CO2 emissions on a quarterly basis, the methodology used, data sources, results, and dissemination strategy. The goal is to create awareness and provide policy makers and the general public with faster and more accessible data on CO2 emissions. The presentation also discusses the differences between IPCC emissions and emissions from economic activities.

E N D
CO2 emissions on a quarterly basis Maarten van Rossum and Sjoerd Schenau Presented by Ellen Brinksma
Content • Why CO2 emissions on quarterly basis? • What do we publish? • Method and data sources • Results • Dissemination strategy and conclusions
Why publish CO2 emissions on quarterly basis? • Demand for faster data • Idea of broad sustainability (welfare is more than GDP) • Create awareness for policy makers and general public • Possibilities for analyses • Eurostat would like to publish faster CO2 data for countries • Interest of businesses
What do we publish? • CO2 emissions by Dutch economic activities • Publication at the same time as first ‘flash’ publication economic growth (t+45) • Disaggregation to some key industrial sectors: • No absolute levels, only changes with respect to previous year • Agriculture, mining, manufacturing and construction • Energy, water and environmental services companies • Transport sector • Other services • Households • Total emissions
Point of departure • Environmental accounts concepts resident principle • Therefore emissions directly comparable with economic key variables like GDP • Not Kyoto data on a quarterly basis • On the basis of existing source statistics
Differences between IPCC emissions and emissions economic activities
How are the quarterly emissions calculated? • Data sources: a) Monthly energy statistics (balances for gas, oil products, renewable energy statistics) b) Quarterly accounts (National accounts) c) Other sources (air traffic information, Sum of degrees below 18 degrees) • Calculation of stationary and mobile sources • Allocation to sectors
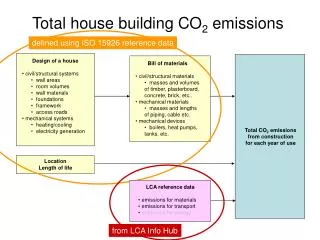
General methodology for stationary and mobile sources • Determine the annual emissions for each energy input in a particular industry (data from Dutch Emission Inventory) • Determine for every quarter the emissions for the different energy inputs in a particular industry. • Select an indicator which is capable of estimating the emissions for the same quarter the next year for a particular energy input in a particular industry. • Aggregate emission to the level of publication and calculate the year to year changes. • Finally, after carrying out the estimation for the four quarters, one has to rebase the sum of the four quarters with the ‘real’ emissions.
Overal quality assesment: macro level • An essential test to assess the overall quality of the applied methodology is to compare the sum of the estimated emissions for the four quarters with both the level and the development of the already existing annual statistic for CO2 emissions from the air emission accounts. • This is very important because one needs to avoid major adjustments in figures in publications. Also, this should avoid difficulties in communicating CO2 emissions to the public.
What has been done so far ? • 2010: pilot study financed by Eurostat • August 2011: First publication CO2 emissions on quarterly basis (low profile) • From 2012 onwards: publication on special website ‘Dutch economy on quarterly basis’
Yearly change in CO2 emissionsEstimate (sum 4 quarters and annual figure)Average absolute error: 0.5 percent
Publication for third quarter 2012on Statistics Netherlands Website Dutch economy (weather corrected) Dutch economy Important: link in article to document where differences in definitions are explained including bridge table (Kyoto emissions, territory emissions, air emission accounts) Transport Services Energy production Water, waste Agriculture, mining, Industry, building % change value added % change CO2 emissions
Quarterly change in CO2 emissions 2008-2009:influence of the economic crisis
Conclusions • CO2 emissions can be constructed and published on quarterly basis 45 days after the end of the quarter • Quality of the data is good • Differences with IPCC emissions Good communication necessary • Large influence of weather: correction temperature necessary • No seasonal correction (yet)