Radio Frequency Interference (RFI)
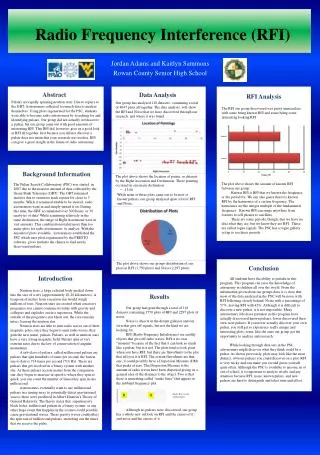
Radio Frequency Interference (RFI). Jordan Adams and Kaitlyn Sammons Rowan County Senior High School. Abstract. Data Analysis. RFI Analysis.

Radio Frequency Interference (RFI)
E N D
Presentation Transcript
Radio Frequency Interference (RFI) Jordan Adams and Kaitlyn Sammons Rowan County Senior High School Abstract Data Analysis RFI Analysis Pulsars are rapidly spinning neutron stars. Due to repairs to the GBT, Astronomers collected too much data to analyze themselves. Using plots regenerated for the PSC, students were able to become radio astronomers by searching for and identifying pulsars. Our group did not actually (re)discover a pulsar, but our group came out with good amounts of interesting RFI. This RFI did, however, give us a good look at RFI all together. Just because you did not discover a pulsar does not mean that your research was useless, RFI can give a great insight in the future of radio astronomy. Our group has analyzed 118 datasets., containing a total of 4047 plots all together. The data analysis. will show the RFI and Noise that we have discovered through our research, and where it was found. The RFI our group discovered was pretty immaculate, with some being known RFI and some being some interesting looking RFI. The plot above shows the amount of known RFI between our group. Known RFI is RFI that we known the frequency, or the period for. We can also guess that it is known RFI by the harmonics of a certain frequency. The harmonics are the integer multiple of the fundamental frequency Known RFI can range anywhere from toasters to cell phones to satellites. There are some periods, though, that we have no idea what they are, but we know they are RFI. These are called rogue signals. The PSC has a rogue gallery set up to see these periods. Background Information • The plot above shows the location of points, or datasets by the Right Ascension and Declination. These pointing occurred in one main declination: • -15:00 The Pulsar Search Collaboratory(PSC) was started in 2007 due to the massive amount of data collected by the Green Bank Telescope (GBT). The GBT remained inactive due to extensive track repairs for close to 3 months. While it remained unable to be steered, radio astronomers went in and simply turned it on. During this time, the GBT accumulated over 300 hours, or 30 terabytes of data! While remaining relatively in the same declination, the range of Right Ascensions were in vast amounts. This combination totaled more than too many plots for radio astronomers to analyze.With the amount of plots available, astronomers established the PSC which uses plots regenerated by the PRESTO software, gives students the chance to find newly discovered pulsars. While none of these plots came out to be new or known pulsars, our group analyzed quite a bit of RFI and Noise. The plot above shows our groups distribution of our plots in RFI (1,750 plots) and Noise (2,297 plots). Conclusion Introduction All students have the ability to partake in this program. This program can raise the knowledge of astronomy in children all over the world. From the information given about our groups data, it is clear that most of the data analyzed in the PSC will be noise with RFI following closely behind. Noise with a percentage of 57%, leaving RFI with 42%. Although it is difficult to discover a new pulsar, it is not impossible. Many astronomers who have partaken in this program have actually discovered known pulsars, fewer discovered their own, new pulsars. If you never actually discover your own pulsar, you still get to experience really unique and interesting plots; some, like the ones our group got the opportunity to analyze and research. While looking through data sets in the PSC, astronomers might discover what they think could be a pulsar. As shown previously, plots may look like the most distinct, obvious pulsars you could discover on a plot. RFI is very tricky and can make you second guess yourself quite often. Although the PSC is available to anyone, in or out of school, it is important to analyze wisely and pay attention because RFI, noise, known pulars, and new pulsars are hard to distinguish and takes time and effort. Neutron stars, a large celestial body packed down into the size of a city (approximately 10-20 kilometers). A teaspoon of matter from a neutron star would weigh millions of tons. Neutron stars are created when a massive progenitor star cannot continue its battle with gravity and collapses and explodes out in a supernova. While the outside of the progenitor star blasts out, the core remains intact, leaving the neutron star. Neutron stars are able to emit radio waves out of their magnetic poles, once they begin to emit radio waves, they gain the new name, pulsars. Pulsars, as well as neutron stars have a very strong magnetic field. Pulsars spin at very extreme rates due to the law of conservation of angular momentum. A sub-class of pulsars, called millisecond pulsars are pulsars that spin hundreds of times per second; the fastest one to date is 714 times per second (714 Hz). These are pulsars that get involved in a binary system with another star. As these pulsars accrete matter from the companion star, they begin to increase in speed to where they spin so quick, you can count the number of times they spin in one millisecond. Astronomers eventually want to use millisecond pulsars in a timing array to potentially detect gravitational waves; these were predicted in Albert Einstein’s Theory of General Relativity. The theory states that supermassive black holes, millisecond pulsars in a binary system, or any other large event that happens in the cosmos could possibly cause gravitational waves. These gravity waves could affect the spin rate of millisecond pulsars, stretching out the times that we receive the pulse. Results Our group had gone through a total of 118 datasets containing 1750 plots of RFI and 2297 plots of noise. Noise is objects in the distant galaxies and our own that give off signals, but not the kind we are looking for. RFI (Radio Frequency Interference) are earthly objects that give off radio waves. RFI is its own “monster” because of the fact that it can look so much like a pulsar, but it is not. The plots tend to look great when you have RFI, but there are flaws/hints to the plot that tell you it is RFI. The certain flaws/hints are that, one, it could possibly have a Dispersion Measure (DM) that peaks at zero. The Dispersion Measure is the amount of radio waves have been dispersed giving us a general idea of the distance to the object. Two is that there is something called “snake bites” that appear in the subband frequency plot. Although no pulsars were discovered, our group has a whole new outlook on RFI and the causes of it; and noise and the causes of it. Snake Bites in the subband plot.