
Uploaded by
robbin
6 SLIDES
270 VIEWS
60LIKES
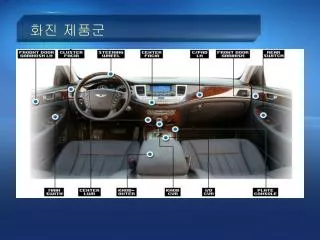
화진 제품군
DESCRIPTION
화진 제품군. ( 억원 ). 1200. 15.0%. 매출액. 14.0%. 영업이익률. 11.8%. 1000. 800. 10.0%. 9.3%. 600. 400. 5.0%. 5.1%. 200. 2.0%. 0. 0.0%. 2008. 2009. 2010. 2011. 2012. 화진 실적. ( 억원 ). 1200. 15.0%. 매출액. 14.0%. 영업이익률. 11.8%. 1000. 800. 10.0%. 9.3%. 600. 400. 5.0%. 5.1%. 200.
Download
1 / 6
Download Presentation 
화진 제품군
An Image/Link below is provided (as is) to download presentation
Download Policy: Content on the Website is provided to you AS IS for your information and personal use and may not be sold / licensed / shared on other websites without getting consent from its author.
Content is provided to you AS IS for your information and personal use only.
Download presentation by click this link.
While downloading, if for some reason you are not able to download a presentation, the publisher may have deleted the file from their server.
During download, if you can't get a presentation, the file might be deleted by the publisher.
E N D
Presentation Transcript
(억원) 1200 15.0% 매출액 14.0% 영업이익률 11.8% 1000 800 10.0% 9.3% 600 400 5.0% 5.1% 200 2.0% 0 0.0% 2008 2009 2010 2011 2012 화진 실적
(억원) 1200 15.0% 매출액 14.0% 영업이익률 11.8% 1000 800 10.0% 9.3% 600 400 5.0% 5.1% 200 2.0% 0 0.0% 2008 2009 2010 2011 2012 화진 실적
(억원) 1200 15.0% 매출액 14.0% 영업이익률 11.8% 1000 800 10.0% 9.3% 600 400 5.0% 5.1% 200 2.0% 0 0.0% 2008 2009 2010 2011 2012 화진 실적
More Related