
51101
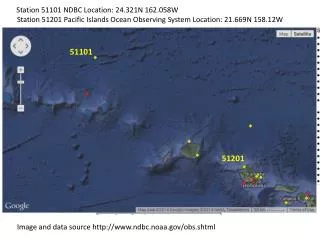
Station 51101 NDBC Location: 24.321N 162.058W. Station 51201 Pacific Islands Ocean Observing System Location: 21.669N 158.12W. 51101. 51201. Image and data source http://www.ndbc.noaa.gov/obs.shtml. Station 51101 NDBC Location: 24.321N 162.058W.

51101
E N D
Presentation Transcript
Station 51101 NDBC Location: 24.321N 162.058W Station 51201 Pacific Islands Ocean Observing System Location: 21.669N 158.12W 51101 51201 Image and data source http://www.ndbc.noaa.gov/obs.shtml
Station 51101 NDBC Location: 24.321N 162.058W Station 51201 Pacific Islands Ocean Observing System Location: 21.669N 158.12W ~hourly data reporting Significant wave heights December 2013-Feburary 2014 Right- skewed distribution With long tail towards high waves
Station 51101 NDBC Location: 24.321N 162.058W Station 51201 Pacific Islands Ocean Observing System Location: 21.669N 158.12W ~hourly data reporting Dominant Period in the Swell December 2013-Feburary 2014 Less skewed distribution than wave heights.
Station 51101 NDBC Location: 24.321N 162.058W Station 51201 Pacific Islands Ocean Observing System Location: 21.669N 158.12W 30ft open ocean swell on Jan 22nd, 2014 51101 51201 Image and data source http://www.ndbc.noaa.gov/obs.shtml
40-50ft waves at reefs http://petethomas.typepad.com/.a/6a0120a77b966b970b01a73d5e76e3970d-pi Image: http://www.petethomasoutdoors.com/2014/01/ giant-swell-slams-hawaii-up-next-is-california-and-mavericks-big-wave-surf-contest.html “The National Weather Service said around 9 a.m. Buoy [51]101, […],reported an ocean swell of 31 feet at 17 seconds. That translates to 50+ feet on the north shore[Buoy 51201] around 7 p.m.” (http://www.hawaiinewsnow.com/story/24509382/forecasters-issue-high-surf-warning-predict-40-50-foot-waves)
(http://www.hawaiinewsnow.com/story/24509382/forecasters-issue-high-surf-warning-predict-40-50-foot-waves)(http://www.hawaiinewsnow.com/story/24509382/forecasters-issue-high-surf-warning-predict-40-50-foot-waves)
(http://www.hawaiinewsnow.com/story/24509382/forecasters-issue-high-surf-warning-predict-40-50-foot-waves)(http://www.hawaiinewsnow.com/story/24509382/forecasters-issue-high-surf-warning-predict-40-50-foot-waves)
(http://www.hawaiinewsnow.com/story/24509382/forecasters-issue-high-surf-warning-predict-40-50-foot-waves)(http://www.hawaiinewsnow.com/story/24509382/forecasters-issue-high-surf-warning-predict-40-50-foot-waves)
Station 51101NDBCLocation: 24.321N 162.058W Station 51201Pacific Islands Ocean Observing System Location: 21.669N 158.12W 30ft open ocean swell on Jan 22nd, 2014! 51101 51201 Image and data source http://www.ndbc.noaa.gov/obs.shtml
Exploring relationships between two (or more) variables At a location two variables form a pair of coordinates (each sample point in the time series becomes a point in the 2-dimensional space).
Exploring relationships between two(or more) variables Scatter plots can help to detect outliers, or different cluster groups in data samples At a location two variables form a pair of coordinates (each sample point in the time series becomes a point in the 2-dimensional space).
Exploring relationships between two (or more) variables Here the same variable (significant wave heights, left; dominant wave periods, right) from two different observing stations are plotted in a scatter-plot
Exploring relationships between two (or more) variables Buoy NW of Hawaii has large waves when waves in Hawaii are (still) small Here the same variable (significant wave heights, left, dominant wave periods) from two different observing stations are plotted in a scatter-plot
Exploring relationships between two(or more) variables The buoy data are shifted by 12 hours (+12h lag in the buoy data from Hawaii)
51101 500 km 51201
Swell direction 500 km 12h shift: Correlation Is maximum when we shift the time series by two 12h
Ocean Wave Theory: t=4 *pi *X/(gT) Distance X= 500km Period: T=17s g=9.81m/s^2 => Travel time t approx 11h Swell direction 500 km 12h shift: Correlation Is maximum when we shift the time series by two 12h