Download
1 / 69
690 likes | 710 Views
Explore the level-3 primer, web tools, case studies, and updates for MODIS Atmosphere products. Understand the L3 algorithm, QA flags, and interactive tools for diagnosing L2 algorithm issues. Discover the multiday algorithm and the MODIS-Atmosphere website features.

E N D
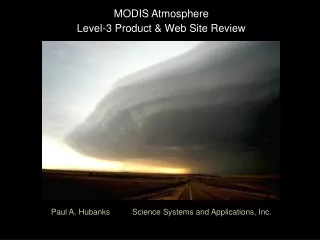
MODIS Atmosphere Level-3 Product & Web Site Review Paul A. Hubanks Science Systems and Applications, Inc.
Presentation Outline: 1. Level-3 (L3) Primer -- High-level algorithm & product description 2. Web Site Review -- Web-based tools and key features 3. Case Studies -- Using web & interactive tools to diagnose algorithm issues 4. L3 Updates -- Collection 005 change summary
Topic 1. The L3 Algorithm
L3 Daily Algorithm: Characteristics Important Limitations: • Limited input - only L2 files • Fixed grid - equal-angle 1x1 degree • Subsampling - L2 pixels sampled at geolocation resolution • No valid range check - inconsistently defined and implemented at L2 - potential to mask L2 algorithm problems Statistical Computation: • Aggregation - using L2 QA flags (e.g: ice vs. water cloud phase) • QA-weighted Statistics - using L2 QA “confidence flags” • Comparison Statistics - joint histogram and/or regression statistics may be computed of one L2 parameter against another
QA or Quality Assurance is a loosely defined term that covers a myriad of ancillary information produced along with with many L2 parameters • QA is described in the QA Plan document (available on the modis-atmos web site -- being updated for Collection 005) • The “runtime” QA flags produced by Level 2 algorithms are typically stored as packed bit-strings in “Quality Assurance” SDS’s. These flags cover many aspects of L2 retrieval parameters including: • Input (ancillary) data sources • Approach (retrieval method) • Various scene attributes • Success or failure of various criteria • Data quality or confidence estimate (QA confidence flags)
QA confidence flags, when computed, are set for every L2 pixel. The four categories (for non-fill L2 data) are: • 0 = No Confidence → 0x weight • 1 = Questionable or Marginal → 1x weight • 2 = Good Confidence → 2x weight • 3 = Very Good Confidence → 3x weight
Unique Characteristics of the L3 Multiday (8-Day and Monthly) Algorithm
L3 Multiday Algorithm: Characteristics 1. Only the L3 daily files used as input (highly efficient) 2. Identical Grid, SDS dimensions, and Histogram Bins 3. Three weighting schemes used to compute multiday statistics from daily statistics • Unweighted (time-averaged mean, meaningful for computing temperature averages) • Pixel count weighted (count-averaged mean, ensures computed means match means from histograms) • Pixels count weighted with pixel count screen
L3 Multiday Weighting Scheme Specification * Weighting is applied to all non-count based statistics (mean, std); but not applied to histograms
Example of “Pixel Count Weighted with Pixel Count Screen” (Multiday Weighting Scheme Update - before and after images) Implemented in L3 on 1 January 2004
Topic 2. The MODIS-Atmosphere Web Site modis-atmos.gsfc.nasa.gov
Data Product Processing and Availability Calendar
LL vs. HA Images: Data Detail Comparison • Equal Angle Grid 1x1° Lat-Lon Native L3 Grid • Equal Area Grid Hammer-Aitoff Computed in IDL from Lat-Lon Image
Usage Statistics – Comparisons from 1 year ago March 2002 – March 2003 • Unique visitors = 63,000 • Total downloads = 137 Terrabytes July 2003 – July 2004 • Unique visitors = 148,000 • Total downloads = 742 Terrabytes
Topic 3. Using web & interactive tools to diagnose L2 algorithm issues 3 Case Studies
Case 1. The “Sahara Streak” (Aerosol)
Computation of Geolocation in L2 Atmosphere Products • 5-km resolution • 5-km geolocation is copied from center (3,3) 1-km L1B input pixel in each 5x5-km area • 10-km resolution • 10-km geolocation is computed by averaging the 4 central (5,5), (5,6), (6,5), (6,6) 1-km L1B input pixels in each 10x10-km area