Download
1 / 43
450 likes | 573 Views
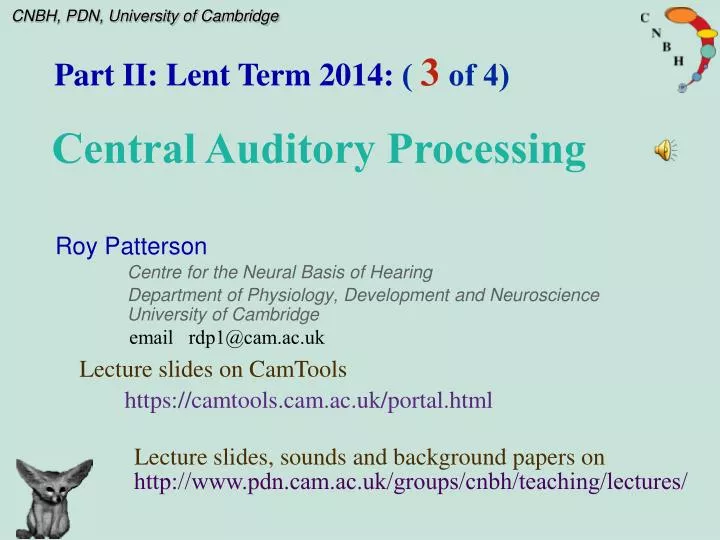
Part II: Lent Term 2014: ( 3 of 4). Central Auditory Processing. Roy Patterson Centre for the Neural Basis of Hearing Department of Physiology, Development and Neuroscience University of Cambridge. email rdp1@cam.ac.uk. Lecture slides on CamTools.

E N D
Part II: Lent Term 2014: ( 3of 4) Central Auditory Processing Roy Patterson Centre for the Neural Basis of Hearing Department of Physiology, Development and Neuroscience University of Cambridge email rdp1@cam.ac.uk Lecture slides on CamTools https://camtools.cam.ac.uk/portal.html Lecture slides, sounds and background papers on http://www.pdn.cam.ac.uk/groups/cnbh/teaching/lectures/
Progress: Act I: the information in communication sounds (animal calls, speech, musical notes) Act II: the perception of communication sounds (the robustness of perception) Act III: the processing of communication sounds in the auditory system (signal processing) Act IV: the processing of communication sounds (anatomy, physiology, brain imaging)
VC LGN LL LL Retina Comparison of Auditory & Visual Pathways Visual Image Auditory Image Light Sound Vision Audition
How does the auditory system process communication sounds and musical notes to separate Ssand Sf from the message?
In the beginning: • Fish have been communicating with sound for over 400 Mya • Frogs have been communicating with sound for over 300 Mya • Fish and frogs do not have a cochlea • The cochlea is a relatively modern invention. • Developed about 100 Mya • Separately by the reptiles, birds and mammals • So what are fish and frogs listening to? • How did/do they analyse sound?
Evolution of Hearing from the Lateral Line System lateral line canal neuromasts
Neuromasts and Hair Cells Primary information is time intervals Hair cell Adapted from Manley (1990) Fig. 2.2
hair bundle links Nayak et al. (2007)
Pulse Resonance The basic element of communication sounds • The pulse marks the start of the communication. • The resonance provides distinctive information about the shape and structure of resonators in the communicator’s body. Amplitude Time
resonance Phase locking in hair cells Isolated transient: initiated by pulse from source, characterised by the resonance pulse amplitude of sound wave Time in ms Firing in response to transient is synchronised to wave (phase-locked) probability of neural firing Time in ms number of time intervals
Information provided by hair cells Isolated transient: initiated by pulse from source, characterised by the resonance amplitude of sound wave Time in ms • Information in the neural pattern: • time intervals re onsettime • peak levels re onset peak probability of neural firing Time in ms number of time intervals
Auditory time-interval histograms: 1 Isolated transient: initiated by pulse from source, characterised by the resonance amplitude of sound wave Time in ms • Information in the neural pattern: • time intervals re onsettime • peak levels re onset peak probability of neural firing Time in ms Capture and store information in an auditory interval histogram number of time intervals Time Interval in ms
Waveform of a child’s /a/ The waveform and spectrum of the vowel /a/
a b Auditory time-interval histograms: 2 amplitude of sound wave Two transients from the same source at times a and b a b probability of neural firing A histogram of time intervals, each measured from the most recent pulse in the sound number of time intervals Time Interval in ms
number of time intervals Auditory time-interval histograms: 3 amplitude of sound wave Multi-pulse processing and the auditory image Time in ms probability of neural firing Time in ms • Aids recognition of recurring isolated transients • Produces a stable image of repeating transients • Enhances signal-to-noise ratio of resonance number of time intervals Time Interval in ms Log Time Interval in ms
Natural variation in sounds and source categorisation Within a species, as the size of an animal increases, the source and the filter grow, increasing SsandSf • Within a species of endothermic animals, • as the temperature of the animal falls, SsandSfincrease, • because colder things vibrate more slowly. It is important that the categorisation mechanism is not confused by these within species changes in the scale values of the sound.
Time-Interval Axis linear log high Carrier Frequency low Pattern is regular for a tuned resonance Pattern is normalised on a log-time-interval axis Pattern shifts but it does not expand Pattern expands as resonance frequency decreases
Transient: • initiated by a pulse • characterised by the resonance amplitude of sound wave Time in ms • Information in the neural pattern: • time intervals re onsettime • peak levels re onset peak probability of neural firing Time in ms Capture, store and normalise information for scale in a log-interval histogram number of time intervals Single-channel Auditory Image Log Time Interval in ms
Basilar partition in the cochlea Hair bundle Outer hair cell Inner hair cell cochlea OUTER HAIR CELLS INNER HAIR CELL BASILAR MEMBRANE Slide provided by Andrew King BASILAR MEMBRANE
pulses resonances pitch period = 8 ms Communication by steams of pulses (with resonances) Amplitude 8 16 24 32 1 Time in ms
Basilar membrane motion in response to a vowel repeated pulses resonances Centre Frequency of Auditory Filter (RBs) Patterson (1994a) Patterson et al. (1995) Time (ms) http://www.pdn.cam.ac.uk/groups/cnbh/teaching/lectures/Pjasj00.pdf
Basilar membrane motion Anatomy of the Auditory Pathway: 1 }
Neural activity pattern in response the /ae/ in ‘hat’ glottal pulses resonances/formants Centre Frequency of Auditory Filter (RBs) Patterson (1994a) Patterson et al. (1995) Time (ms)
Neural activity pattern in response the /ae/ in ‘hat’ Centre Frequency of Auditory Filter (RBs) Time (ms) http://www.pdn.cam.ac.uk/groups/cnbh/teaching/lectures/Pjasj00.pdf
} Neural activity pattern
STI in three NAP channels 2.4-kHz strobe time 2.4-kHz channel 1.2-kHz strobe time 1.2-kHz channel 0.6-kHz strobe time 0.6-kHz channel
Neural activity pattern in response the /ae/ in ‘hat’ Centre Frequency of Auditory Filter (RBs) Patterson (1994a) Patterson et al. (1995) Time (ms)
2.4 kHz 1.2-kHz 0.6-kHz Stabilised auditory image of the /ae/ in ‘hat’: 1 Tonotopic axis of cochlea time interval, ms 0-ms time interval in all channels
Stabilised auditory image of the /ae/ in ‘hat’: 2 formants glottal pulses pitch Patterson (1994b) Patterson et al. (1995) Tonotopic axis of cochlea http://www.pdn.cam.ac.uk/groups/cnbh/teaching/lectures/Pjasj00.pdf
} Strobed temporal integration
} Auditory Image
I: There is size information in communication sounds: - speech, music and animal calls IV: VI: V: Auditory perception is amazingly robust to the size variability in communication sounds Machine recognition systems are NOT robust to size variability, even for single-speaker, clean speech So how does the auditory system do it? III: II: Humans can extract the size information without being confused by the content of the communication Humans can extract the content of the communication without being confused by the size information Review of size processing http://www.pdn.cam.ac.uk/groups/cnbh/teaching/lectures/PDIica07.pdf
high pitch low pitch short vocal tract short vocal tract high pitch long vocal tract Scaled versions of a two-formant vowel Irino andPatterson (2002) Patterson, van Dinther and Irino (2007) (ICA, Madrid) low pitch long vocal tract
Neural activity patterns for 2-formant vowels Patterson, van Dinther and Irino (2007) (ICA, Madrid)
Neural activity patterns for 2-formant vowels Patterson, van Dinther and Irino (2007) (ICA, Madrid)
Neural activity patterns for 2-formant vowels Patterson, van Dinther and Irino (2007) (ICA, Madrid)
Expanded Neural activity patterns for 2-formant vowels Patterson, van Dinther and Irino (2007) (ICA, Madrid)
Expanded Neural activity patterns for 2-formant vowels Patterson, van Dinther and Irino (2007) (ICA, Madrid)
scale-shift covariant Auditory Image{log2cycles, log2scale} Patterson, van Dinther and Irino (2007) (ICA, Madrid)
Conclusion: A functional model of how the auditory system segregates the size information and from the message in communication sounds (a hypothesis based on signal processing). The auditory system performs a frequency analysis with an auditory filterbank and records the times of the amplitude peaks with neural pulses. In each channel, the timing information is converted into a time-interval histogram, which stabilizes the repeating pattern and segregates the Pulse Rate information from the message and the VTL information. The time-interval dimension is expanded in proportion to channel frequency, to segregate the VTL information from the message. http://www.pdn.cam.ac.uk/groups/cnbh/teaching/lectures/PDIica07.pdf
LL LL Anatomy of the Auditory Pathway: 1
End of Act III Thank you Patterson, R.D., Allerhand, M., and Giguere, C., (1995). "Time-domain modelling of peripheral auditory processing: A modular architecture and a software platform,” J. Acoust. Soc. Am. 98, 1890-1894. http://www.pdn.cam.ac.uk/groups/cnbh/teaching/lectures/PAG95.pdf Patterson, R.D. (2000). Auditory images: How complex sounds are represented in the auditory system. J AcoustSoc Japan (E)21(4) 183-190. http://www.pdn.cam.ac.uk/groups/cnbh/teaching/lectures/Pjasj00.pdf Patterson, R. D., van Dinther, R. and Irino, T. (2007). “The robustness of bio-acoustic communication and the role of normalization,” Proc. 19th International Congress on Acoustics, Madrid, Sept, ppa-07-011. http://www.pdn.cam.ac.uk/groups/cnbh/teaching/lectures/PDIica07.pdf