Download
1 / 39
390 likes | 464 Views
This report analyzes budget allocation for maternal and child health services from 2009 to 2013 in Bauchi and Sokoto States, highlighting strengths and weaknesses in budgeting practices.

E N D
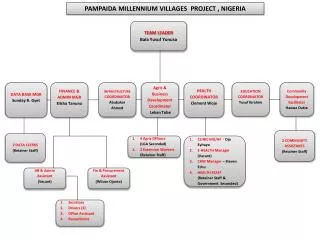
Nigeria Targeted State High Impact Project(TSHIP) Review of Primary Health Care Budgeting and Financing in Bauchi and Sokoto States, 2009-2013
Acknowledgements TSHIP Dr. Nosa Orobaton “ Abubakar Maishanu “ Habib Sadauki “ Benson Ojile “ Goli Lamiri “ Usman Al-Rashid Abubakar Muazu Nurudeen Lawal John Snow, Inc. Matthew Osborne-Smith Alexander Nosnik LEAD-RTI Project Musa Wamakko Grace Okechukwu Connect-To-Health Dr. Ibukun Ogunbekun “ Tiwalade Awosanya Prepared by Connect-To-Health, LLC (May 2014)
Acronyms • CSO - Civil Society Organization • FP/RH - Family Planning/Reproductive Health • LEAD - Leadership, Empowerment, Advocacy and Development • LGA- Local Government Area • LGSC- Local Government Service Commission • MDG- Millennium Development Goal • MNCH- Maternal, newborn and Child Health • NDHS- National Demographic and Health Survey • NGO – Non Governmental Organization • NHIS - National Health Insurance Scheme • NHMIS - National Health Management Information System • NPHCDA- National Primary Health Care Development Agency • RTI- Research Triangle Institute • SMOH - State Ministry of Health • SMOLGA - State Ministry for Local Government Affairs • TSHIP – Targeted State High Impact Project • WHO - World Health Organization • WMHCP- Ward Minimum Health care Package Prepared by Connect-To-Health, LLC (May 2014)
Overview • Five (5)-year project financed from grants from the USAID • Launched in 2009 • Managed by consortium of 5 organizations with John Snow, Inc. (JSI) as Prime Contractor • Covers all 20 LGAs in Bauchi and 23 LGAs in Sokoto State • Project focuses on improving and supporting: • Maternal, newborn and child health (MNCH) • Family Planning/Reproductive Health (FP/RH) • Quality of health care • Community engagement • Effective health systems Prepared by Connect-To-Health, LLC (May 2014)
Characteristics of Target Population Targeted states have weak socio-economic and health profiles: • High Infant Mortality Rates (109 and 91 per 1,000 live births in Bauchi and Sokoto states, respectively) • Only 1% of children aged 12-23 months were fully immunized in both states in 2008 • Births supervised by skilled attendant = 16% (Bauchi) and 5% (Sokoto) • High rates of youth unemployment and poverty • Weak health systems – poor infrastructure, skewed human resource distribution, unpredictable financing poor quality of care Prepared by Connect-To-Health, LLC (May 2014)
Study Rationale • In 2009-2012: TSHIP and LEAD-RTI project assisted LGAs to develop strategic and operational plans and improve budgeting process • Additional support is required in the medium term to build institutional capacity at state and LGA levels Prepared by Connect-To-Health, LLC (May 2014)
Specific Objectives • Review trends in budget allocation, appropriateness and timeliness of release of funds for MNCH and FP/RH, and the adequacy of budgets • Project budgetary requirements for delivery of MNCH and FP/RH services in LGAs in Bauchi and Sokoto states from 2013 to 2015 • Determine availability of funds for and gaps in resource allocation to MNCH and FP/RH services and commodities by govt. and partners Prepared by Connect-To-Health, LLC (May 2014)
Methods Quantitative and Qualitative approaches were used to obtain information – mostly the former Sampling technique: • Convenience sampling with uniform criteria adopted for both states to enhance representativeness and comparability of findings Data comprised the following: • MNCH service delivery data (2012) – were used to segment LGAs into low, medium and high utilization categories • Health finance (revenue & expenditure) data– covering the period 2009 to 2013 • Health service utilization data (2012) – from 3 PHC centers and 6 HCs per LGA making a total of 12 HFs per state • Costing of PHC services – standard costs for scaling up health MDGs were adopted in the absence of costed WMHCP# Prepared by Connect-To-Health, LLC (May 2014)
Methods Prepared by Connect-To-Health, LLC (May 2014)
Findings: Budgeting Current Approach • Incrementalism: next year’s budget = this year’s budget multiplied by a factor for revenue as well as expenditure • Total budget = Capital + Recurrent (Personnel + Overheads) Strengths • Clear guidelines on assumptions underlying budgets given – circular from SMOLGA usually stipulates assumptions and scaling factor to be used; LG councils are expected to comply • Guidelines also given on proportion to be allocated to capital and recurrent expenditure – for 2013 budget, capital expenditure was pegged at 40-45% of actual revenues in previous year Prepared by Connect-To-Health, LLC (May 2014)
Findings: Budgeting Weaknesses • Lack of consistency in reporting format among LGAs and between LGAs & State – makes comparability of budgets difficult • Scaling factor applied to budgets bears little relationship to previous year’s performance or planned/strategic shifts in future service offerings • PHC departments submit budget proposals but may not be invited to defend proposals – practice varies across LGAs Prepared by Connect-To-Health, LLC (May 2014)
Findings: Budgeting How well did LGA councils adhere to 2013 Budget Guidelines? For Dass and Katagum LGAs (Bauchi State): • A fifteen percent (15%) increase was applied across the board using 2012 actuals as base • Capital expenditures were kept at 40% of total budget estimate • Capital health expenditure estimates were 13% higher than 2012 actuals – this is tolerable considering that actual expenditures in 2011 were 102% of approved estimates • Overall, the findings are positive, suggesting that the investment in training of budget officers is bearing fruit Prepared by Connect-To-Health, LLC (May 2014)
Findings: Expenditure Trends Evidence, mostly from Bauchi State, show that: • LGA revenues come mainly from federal govt. allocations – these account for >95% of total revenues (Chart 1 below) • Internally Generated Revenue (IGR) is very low and declining - averaged only 2% of annual total revenue Prepared by Connect-To-Health, LLC (May 2014)
Findings: Expenditure Trends • Approved Estimates vs. Actual Expenditures • Gap between approved budgets and actual expenditures (budget variance) is large and fluctuates widely from year to year • In Sokoto State, actual state expenditure (all sectors) stood at around 44% of approved estimates for 2010 and 2011 • Spending pattern appears more predictable at LGA level – in Katagum LGA, actual health spending averaged 97% of approved estimates in 2010-2012 (Chart 2) Prepared by Connect-To-Health, LLC (May 2014)
Findings: Expenditure Trends Table 2: Select Health Finance Indicators for Bauchi State, 2012 Prepared by Connect-To-Health, LLC (May 2014)
Findings: Expenditure Trends In Katagum LGA: • Approx. 18-20% of total LGA expenditure was allocated to health(2010–2012); surpassed national benchmark of 15% • Health spending per capita grew by 3% per year from ₦1,031 in 2010 to ₦1,135 in 2012 – equivalent to an average of US$7.0 in real terms or US$12.5 in purchasing power parity (PPP) terms • Personnel costs averaged only 45% of total health expenditures (2011-2012) or 61% of recurrent health budgets – leaves a good margin for overhead costs Prepared by Connect-To-Health, LLC (May 2014)
Findings: Expenditure Trends • The evidence suggests an upward trendin PHC financing. • Overall, spending per head is lowbut comparable to what other low-to-lower middle income countries spend (Table 3) Prepared by Connect-To-Health, LLC (May 2014)
Findings: Expenditure Trends • Likewise in Dass LGA: • Total expenditure (all sectors) was up 73% (2009-2012) – increase is attributed largely to growth in capital expenditures and overhead costs, which rose by 60% and 105%, respectively • Capital expenditure vote was overspent by 22% but only 76% of recurrent vote was spent (2009-2012) – probably due to inability to fill staff vacancies • For both LGAs: • Total actual expenditures (All Sectors) were in the range of 100% of total revenues received (see Chart 3 below) Prepared by Connect-To-Health, LLC (May 2014)
Findings: Expenditure Trends • Finding is consistent with claims made by LGA officials that they had no difficulty consuming allocated funds • It is, perhaps, the strongest indication yet that more funds need to flow to this level to accelerate development • Obvious limitation is that LGAs have virtually no slack – they are not in a position to respond to emergencies or take advantage of opportunities that may arise in any given year Prepared by Connect-To-Health, LLC (May 2014)
Findings: Expenditure Trends Data from Sokoto State indicated that: • On the average, the State Govt. spent 6 out of every 10 naira received in revenue between 2009 and 2011 (Chart 4) • Whereas, actual spending on all sectors was just around 44% of forecasts for FY2010 and 2011, actual personnel expenditures averaged 80% of forecast Prepared by Connect-To-Health, LLC (May 2014)
Findings: Expenditure Trends • Actual capital health expenditure as % total capital expenditure shrank from 4.6% to 2.9% (2010-2011) In Bauchi State : • Percentage-wise and in per capita terms, health spending at State level appeared even lower than that at LGA level • In FY2010 and 2011, Total health expenditures at 6 months averaged only ₦470 per head (Table 1 above) • If the pattern held true for the entire year, per capita spending would be just ₦940 or US$5.8 (PPP) Prepared by Connect-To-Health, LLC (May 2014)
Findings: What is Money Spent On? Infrastructure • Capital projects development is joint State/LGA affair - LGAs contribute 40% and state government, 60% of total costs but the state largely controls the purse • Multiple partners construct/rehabilitate PHC units and supply medical equipment but central coordination is weak – potential for duplication of assets and waste is considerable • Inadequate provision for (incremental) recurrent costs of new projects is a growing concern – undermines sustainability of service improvements Prepared by Connect-To-Health, LLC (May 2014)
Findings: What is Money Spent On? Human Resources • In general, greater balance is seen in allocations to HR vs. the other two major cost categories (i.e. capital and overheads) • LGA personnel costs grew at a relatively slow pace between 2009 and 2012 despite salary increase for public sector workers • In Dass LGA, personnel costs as share of total LGA expenditures hovered around 60%, whereas, • Katagum LGA saw a decline from 57% to 48% (due in part to greater scrutiny over payroll accounts) Prepared by Connect-To-Health, LLC (May 2014)
Findings: What is money spent on? • Drugs, vaccines & medical supplies • Spending on drugs, vaccines and medical supplies is very low– accounted for only 3% of combined health expenditures for 2011 and 2012 in KatagumLGA (Approved estimates) • Drug Revolving Funds (DRFs) have not curbed supply chain problems: • In many LGAs, DRF is a push, not pull system • In one community, the seed stock of drugs supplied cost more per dose than in retail pharmacies • In others, items supplied did not match health facility requests Prepared by Connect-To-Health, LLC (May 2014)
Findings: What is Money Spent On? Overheads • PHC facilities and LGA health depts. receive grossly insufficient funding: • Bagarawa PHC (Bodinga LGA, Sokoto State) reports monthly imprest of ₦10,000 whereas Takatuku Health Center in same LGA claims to not receive any • State policy favors shifting resources from capital to overhead but response is mixed – approved estimates for Overheads in 2013 relative to 2012 ranged from -6% in Dass and Sokoto South LGAs to +6% in Wamakko LGA • WDCs bridge gaps in funding - in Sokoto South LGA, health facility needs costing more than ₦10,000 are referred to the WDC, which raises needed funds Prepared by Connect-To-Health, LLC (May 2014)
Findings: What is Money Spent On? Communal bore hole in health clinic premises, Sokoto South LGA – maintained by the WDC Prepared by Connect-To-Health, LLC (May 2014)
Findings: LGA Budgets vs. Health Sector Strategic Plan To examine how close LGAs came to meeting medium-term health financing goals, estimates of per capita and total health expenditures from the following sources were compared: • Local government council annual budgets (Actuals only) • Costed annual operational plans extracted from LGA health sector strategic plans • Cost estimates for scaling up the MDGs. Prepared by Connect-To-Health, LLC (May 2014) Prepared by Connect-To-Health, LLC (Apr. 2014)
Findings: LGA Budgets vs. Health Sector Strategic Plan • To finance the operational plan solely from own resources, Dass LGA would have needed to commit more than one-third (36%) of total annual revenues for 2011 to the health sector alone – a somewhat unlikely proposition • The proportion would drop to one-quarterif the LGA covered 69% of costs as proposed in the plan with the state government and development partners contributing 5% and 26%, respectively Prepared by Connect-To-Health, LLC (May 2014)
Findings: Cost of Scaling-up MDGs • Despite improvements in funding, health spending in Katagum LGA appeared not to have kept pace with population need • Deficit was of the order of US$2.86 (approx. ₦450) per inhabitant by FY 2012 • Put in context, the deficit is almost half (48%) of the average amount spent per head per year by the Bauchi State government to provide health care in FY2010 & 2011 Prepared by Connect-To-Health, LLC (May 2014) Prepared by Connect-To-Health, LLC (Apr. 2014)
Findings: Cost of Scaling-up MDGs Even so, Katagum had met 72% of financing requirement for health MDGs as at 2012. Shortfalls in spending could thus be bridged via: • Modest increase in spending annually to keep pace with inflation and population growth • Review of investment priorities, and • Reduction in waste - especially in relation to infrastructure and human resource development Prepared by Connect-To-Health, LLC (May 2014) Prepared by Connect-To-Health, LLC (Apr. 2014)
Looking Ahead Ample resources are available locally to support better planning, budgeting and management of PHC: • Inventoryof health facilities, equipment and human resources in both states have been done and gaps quantified • GIS mapping of health facilities in Sokoto State has been completed • HR policyand strategic plan developed for Bauchi State • Health sector strategic plans covering 2010-2015 developed by LGAs in Bauchi State • Nation-wide mapping of health resources is on-going (courtesy of HS 20/20 project) Tremendous opportunity exists currently to fast-track attainment of the MDGs!! Prepared by Connect-To-Health, LLC (May 2014) Prepared by Connect-To-Health, LLC (Apr. 2014)
Recommendations Cost of Minimum Package • Review costing of WMHCP (first done in 2007) – disseminate revised estimates widely • Revise LGA estimates for scaling up the MDGs – use data specific to Nigeria to refine MDG unit costs pending revision of cost of WMHCP Prepared by Connect-To-Health, LLC (May 2014) Prepared by Connect-To-Health, LLC (Apr. 2014)
Recommendations Quality of Budgets • Apply health service utilization data generated from facility-based and outreach services to improve demand forecasts and better plan infrastructure and human resource development • Further disaggregate social sectors data – separate health spending from education and other subsectors • Ensure adequate provision for recurrent costsof proposed capital projects Prepared by Connect-To-Health, LLC (May 2014) Prepared by Connect-To-Health, LLC (Apr. 2014)
Recommendations Quality of Budgets • Show actual revenues and expenditures for preceding periodin proposed budgets with lag period no further than 2 years (e.g. 2014 budget to display actuals for FY2013 or 2012) • Institute budget performancereviews as part of the budget development process • Reclassify expenditures on drugs and medical supplies as “recurrent” rather than “capital” Prepared by Connect-To-Health, LLC (May 2014) Prepared by Connect-To-Health, LLC (Apr. 2014)
Recommendations Resource Management • Establish formal platform for partners/stakeholders to meet quarterly or half-yearly to review investment priorities • Use GIS mapping to improve resource planning • Rationalize types and numbers of health facilities • To simplify management of health services particularly in such situations where technical/management capacity is limited • To make the health system “leaner” and more functional • Reallocate Human Resources –a difficult but necessary step to complement investment in infrastructure and equipment Prepared by Connect-To-Health, LLC (May 2014) Prepared by Connect-To-Health, LLC (Apr. 2014)
Recommendations Financing Options • Advocate for independent review of local government joint accounts – engage policy makers and key stakeholders in candid search for options • Revisit Community Based Health Insurance – cost is still an issue; according to the NDHS (2008): • 56% of women aged 15-49 years stated that finance was a barrier to accessing care for self • 41% cited the likelihood of not getting drugs, and • 36% felt distance was an issue • Define health finance indicators for LGA-level reporting on the NHMIS • Initiate discussion with the FMOH on data requirement, indicators and benchmarks • Enlist the help of other partners Prepared by Connect-To-Health, LLC (Apr. 2014) Prepared by Connect-To-Health, LLC (May 2014)
References • Ashir G, Doctor H, and Afenyadu, G. 2013. Performance based financing and uptake of maternal and child health services in Yobe State, Nigeria. Global Journal of Health Science; 5(3): 34-41 • Bauchi State Ministry of Health. (2012). Human resources for health policy and planning, 2012-2015 (second draft), May 2012 • Minis H, Jibrin A. (2011). An analysis of intergovernmental flows for local services in Bauchi and Sokoto States. LEAD project, RTI, Research Triangle, NC • Ministry of Health, Sokoto (2012) Standard Estimates for Health Resources Availability and Needs for Sokoto State, 2012 Prepared by Connect-To-Health, LLC (Apr. 2014) Prepared by Connect-To-Health, LLC (May 2014)
References • National Bureau of Statistics (2012). Millennium Development Goals performance tracking survey result. 2012 Abuja, Nigeria • National Planning Commission. Nigeria Millennium Development Goals (MDGs): Countdown Strategy 2010:2015 • National Population Commission and ICF Macro. (2009). Nigeria Demographic and Health Survey 2008: Key findings. Calverton, Maryland, USA: NPC and ICF Macro • Targeted State High Impact Project (TSHIP). (2010). Health facility rapid assessment: baseline survey report. TSHIP Central Project Office, Bauchi • WHO. (2009). Constraints to Scaling Up Health related MDGS: Costing and Financial Gap Analysis. WHO, Geneva Prepared by Connect-To-Health, LLC (May 2014) Prepared by Connect-To-Health, LLC (Apr. 2014)
Thank You! Prepared by Connect-To-Health, LLC (May 2014)