Download
1 / 46
460 likes | 476 Views
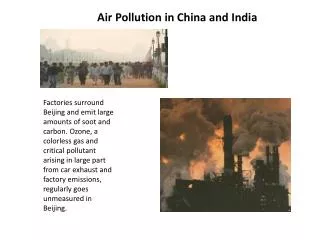
Air pollution in India Achievements and challenges 22 nd Oct 2013 Sumit Sharma, Fellow, TERI. Air pollution disasters- shifting bases. London Smog of 1952 Donora, Pennsylvania, US, 1948. Scope. Indian growth story. Growth of India. 463 times 3.5 times 50 times. Urban centres.

E N D
Air pollution in India Achievements and challenges 22nd Oct 2013 Sumit Sharma, Fellow, TERI
Air pollution disasters- shifting bases • London Smog of 1952 • Donora, Pennsylvania, US, 1948
Growth of India 463 times 3.5 times 50 times
Urban centres Urban agglomerates 53 cities with population more than 1 million
Growth in Number of Motor Vehicles Others: tractors, trailors, three wheelers (passenger vehicles), etc • Over 1/3rd of the total vehicles in 53 million +cities • Second tier cities show greater increase in vehicle population MoRTH, 12
Expect more growth About 28000 two wheelers, and 4200 cars added to India’s vehicular fleet daily (2011) As per Census 2011, 21% households have two wheelers whereas 4.7 % have cars/jeeps/vans More growth expected Data WDI, 2011
Lack of public transport infrastructure Metros just started in few cities Buses are just 1% of the total vehicular fleet Inconvenience in public transport leading to more private vehicle ownership in most of the cities Low vehicles/Population in Mumbai, Kolkata having better public infrastructure
Auto Fuel Policy 2002 Bharat Stage II Bharat Stage III Bharat Stage IV Category Entire country April 2005 Entire country April 2010 To be decided 2 & 3 wheelers All other new vehicles Entire country Entire country April 2010 13 cities- April 2005 20 cities by April 2010 No date for rest of the country ? April 2005 11 cities- April 2003 15
Regional differentiation One set of standards for air quality Different vehicle emission and fuel quality standards for 13 cities and rest of the country Many other cities in the country are much more polluted than the ones where better quality fuel is presently provided. Better quality vehicles moving out of 20 cities, may fill the inferior quality fuel and may end up choking their engines No road map after 2010
Learnings from AFP2002 The rate of increase in pollution levels in Bharat III cities moved along a significantly lower trajectory than a BAU scenario would have indicated During this time, the increase in pollution levels in non-Bharat III cities was steep No progress has been made on performance improvement of in-use vehicles
Impact on air quality (PM10) *13 cities : Selected in AFP, 2002 for advanced implementation of BS norms ** Other cities which show higher increase in RSPM in the last 8 years. Data source : CPCB, NAMP
Learnings from AFP2002 Heavy duty trucks (highest contributors to PM) could not achieve BS-IV norms due to unavailability of fuel across the country Very high growth of vehicles negated the benefits provided by AFP 2002 The focus was more on PM control and less reductions achieved in NOx , and hence, further advancements required The share of older highly polluting vehicles in emissions is going to reduce in future , hence need to focus on improving emissions from newer vehicles Old driving cycles used for testing may not result in on-road reductions as depicted during emissions tests.
Effects of introduction of BS norms (2010) on emissions -19% TERI’s estimation PM reductions have been more than NOx
Inuse vehicles -Unaccounted emissions due to driving cycles for emission testing
Unaccounted emissions … • Unregistered vehicles • Overloading • Limited maintenance and ineffective PUC system
Transport – Its not just PM !! Highest contributor to NOx emissions in India Gaseous pollutants (NOx, SO2, VOCs) lead to secondary PM formation NOx and VOCs can lead to formation of ground level Ozone (impacts health + agriculture) BC (a constituent of PM) has a significant warming potential. 23
Air quality (2011) NAMP data
Air quality (2011) NAMP data
Urban air quality (Delhi)- PM10 Banning old vehicles Cleaner fuels and vehicles Shift industries
PM2.5 is 5th Leading Mortality Risk Factor Ambient PM2.5 caused an estimated 627,000 deaths ̴ 6% of all deaths in 2010 GBD-Lancet, 2012
Transport emissions and climate change • Particles emitted from diesel vehicles contain black carbon • Gases (NOx, VOCs) emitted from different sources form Ozone • Black carbon is now known to have second highest radiative forcing after CO2 • Other than health and agricultural effects it is contributing to warming of the planet • Reducing emissions may result into co-benefits Black carbon Ozone 40
Radiative Forcing of Climate (1750 to present):Important Contributions from Air Pollutants
What IPCC- AR5 says • 43% higher RF mainly due to growth in GHGs and improved estimates of RF by aerosols indicating a weaker net cooling effect. • Climate models now include more cloud and aerosol processes, and their interactions • Observational and modelling evidences suggest locally higher surface temperatures in polluted regions will increase peak levels of ozone. • Short term climate forcers, such as black carbon can be comparable to CO2’s for short time horizons , but in the long term the effect of CO2 dominates .
Effect of Vapour Recovery System on VOC at fuelling stations in Urban Delhi during winter
Solutions for control of transport emissions • Control • Provide ULSD in the entire country and a clear roadmap for advancement of emission norms for the whole country • Effective inspection and maintenance program • Standards for fugitive emissions • Shift • Enhancement of public transport (bus/rail/waterways) and non-motorized transport • Alternate fuels: CNG, LPG etc. 45